GFDatabase... for when a (very) long-term perspective is needed
Published by Mark BodnarYou might want to sit down for this one... the world was not created at the same time as the modern internet! In fact, both our little blue globe and the societies it hosts were around for quite a while prior to that. The world also predates online journals, social media (Facebook = 2004), and online databases such as Passport, IBISWorld, and Frost & Sullivan.
That may seem obvious, yet so much of the research done today focuses on resources that can be accessed online, digital information that can be found and analyzed quickly... often from home on a snowy day while wearing pajamas. As convenient as it is, relying solely on online information introduces a dangerous bias in research. It's true that an increasing amount of older information is being digitized every day, but that is still just a tiny sample of all the information that has been produced. Limiting your research to only online sources introduces a shortsightedness that can affect your conclusions and your decisions.
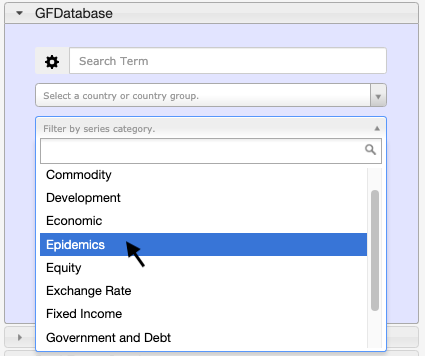
As I've mentioned before, the main advantage of GFDatabase is that it provides incredibly deep historical coverage of major macroeconomic indicators and commodity prices... with some time series extending across centuries.
Creating such uniquely long time series involves consulting multiple sources, including many that are only available in print format. That process may dig up a few years or decades of data from each source, but often with slightly different definitions, base years, geographic scopes, etc.
The economists behind GFDatabase then adjust for such variations, weave the fragments together into unified time series, and provide the data online. And, because all good researchers want to understand where their data came from, GFDatabase provides details on the sources and methods used for each series, and its experts are available to directly answer questions.
The end result is an online source that fills a gap in most modern research: others have plumbed the depths of dusty old books so you don't have to! (Cue both remote access and pajamas!) However, that really only answers the What and How questions about GFDatabase. Today, I'd like to talk about Why questions. Specifically: Why are long time series valuable, even in cases where your focus is on the last few years?
Consider the 10-year yield rate on Canadian government bonds. Economists and finance researchers sometimes use the 10-year yield on such instruments as a proxy measure for mortgage rates and for investor sentiment about the economy. Here's a chart from the Bank of Canada site showing the trend in that rate since 2001:
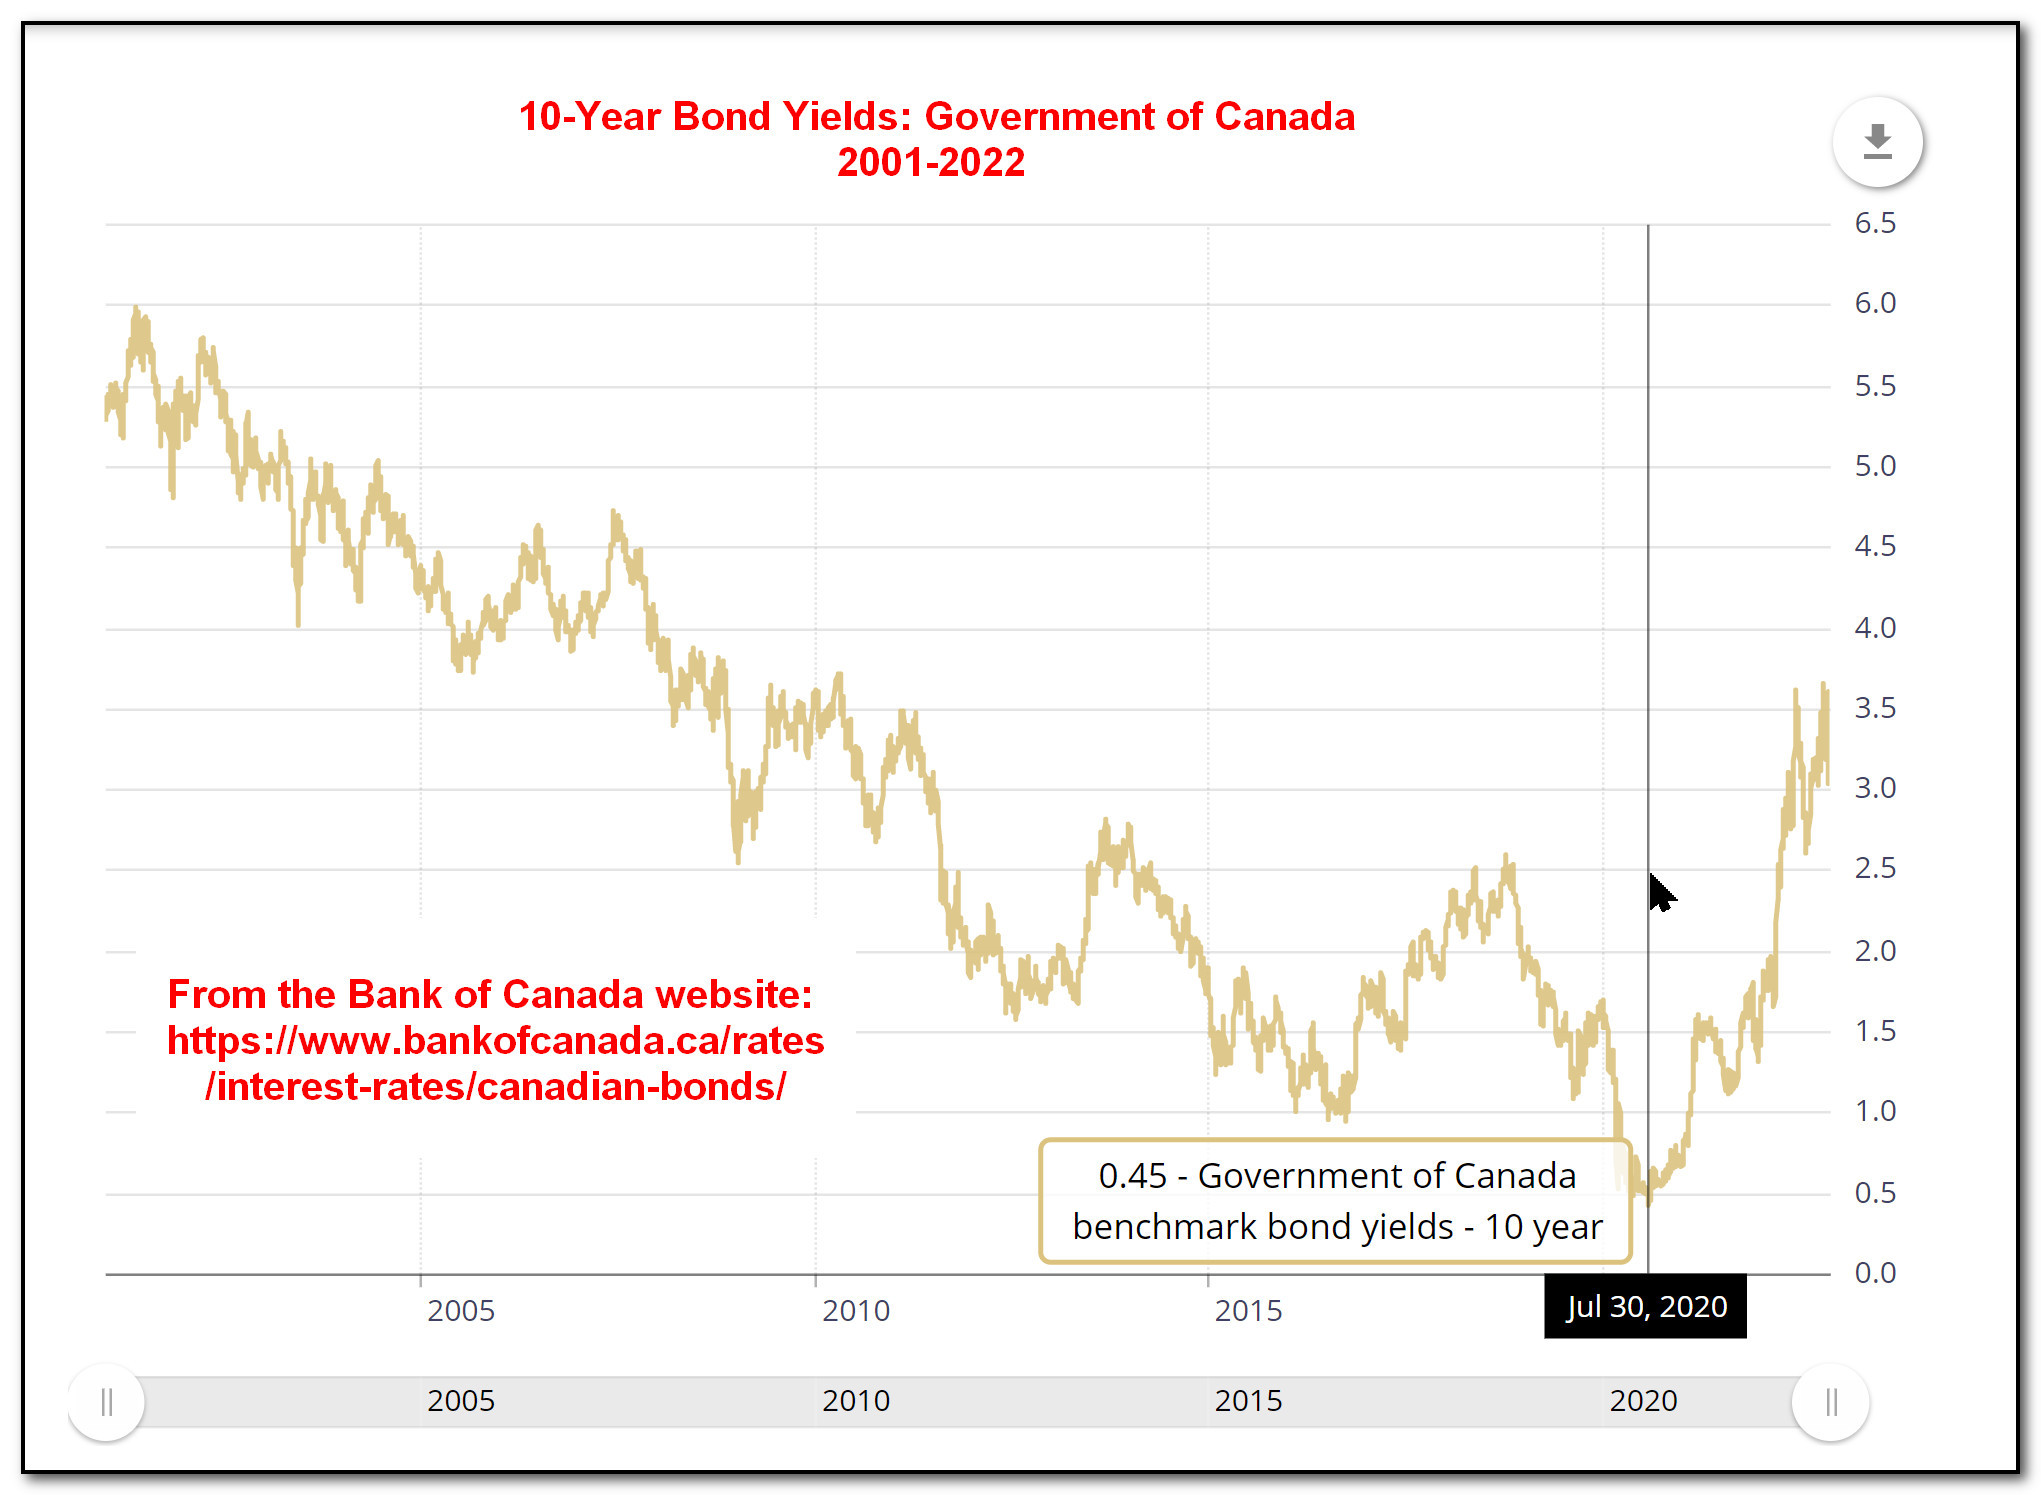
The fact that the yield here in Canada was at its lowest in 20 years in July 2020 is important to take into account as we examine the effect of the pandemic. Based on data from only the last 20 years, the current volatility of the measure and the recent low rate seem to be extraordinary. However, if that perception is inaccurate, we might draw faulty conclusions about causes, effects, and solutions. Here's a longer view of that same indicator from GFDatabase:
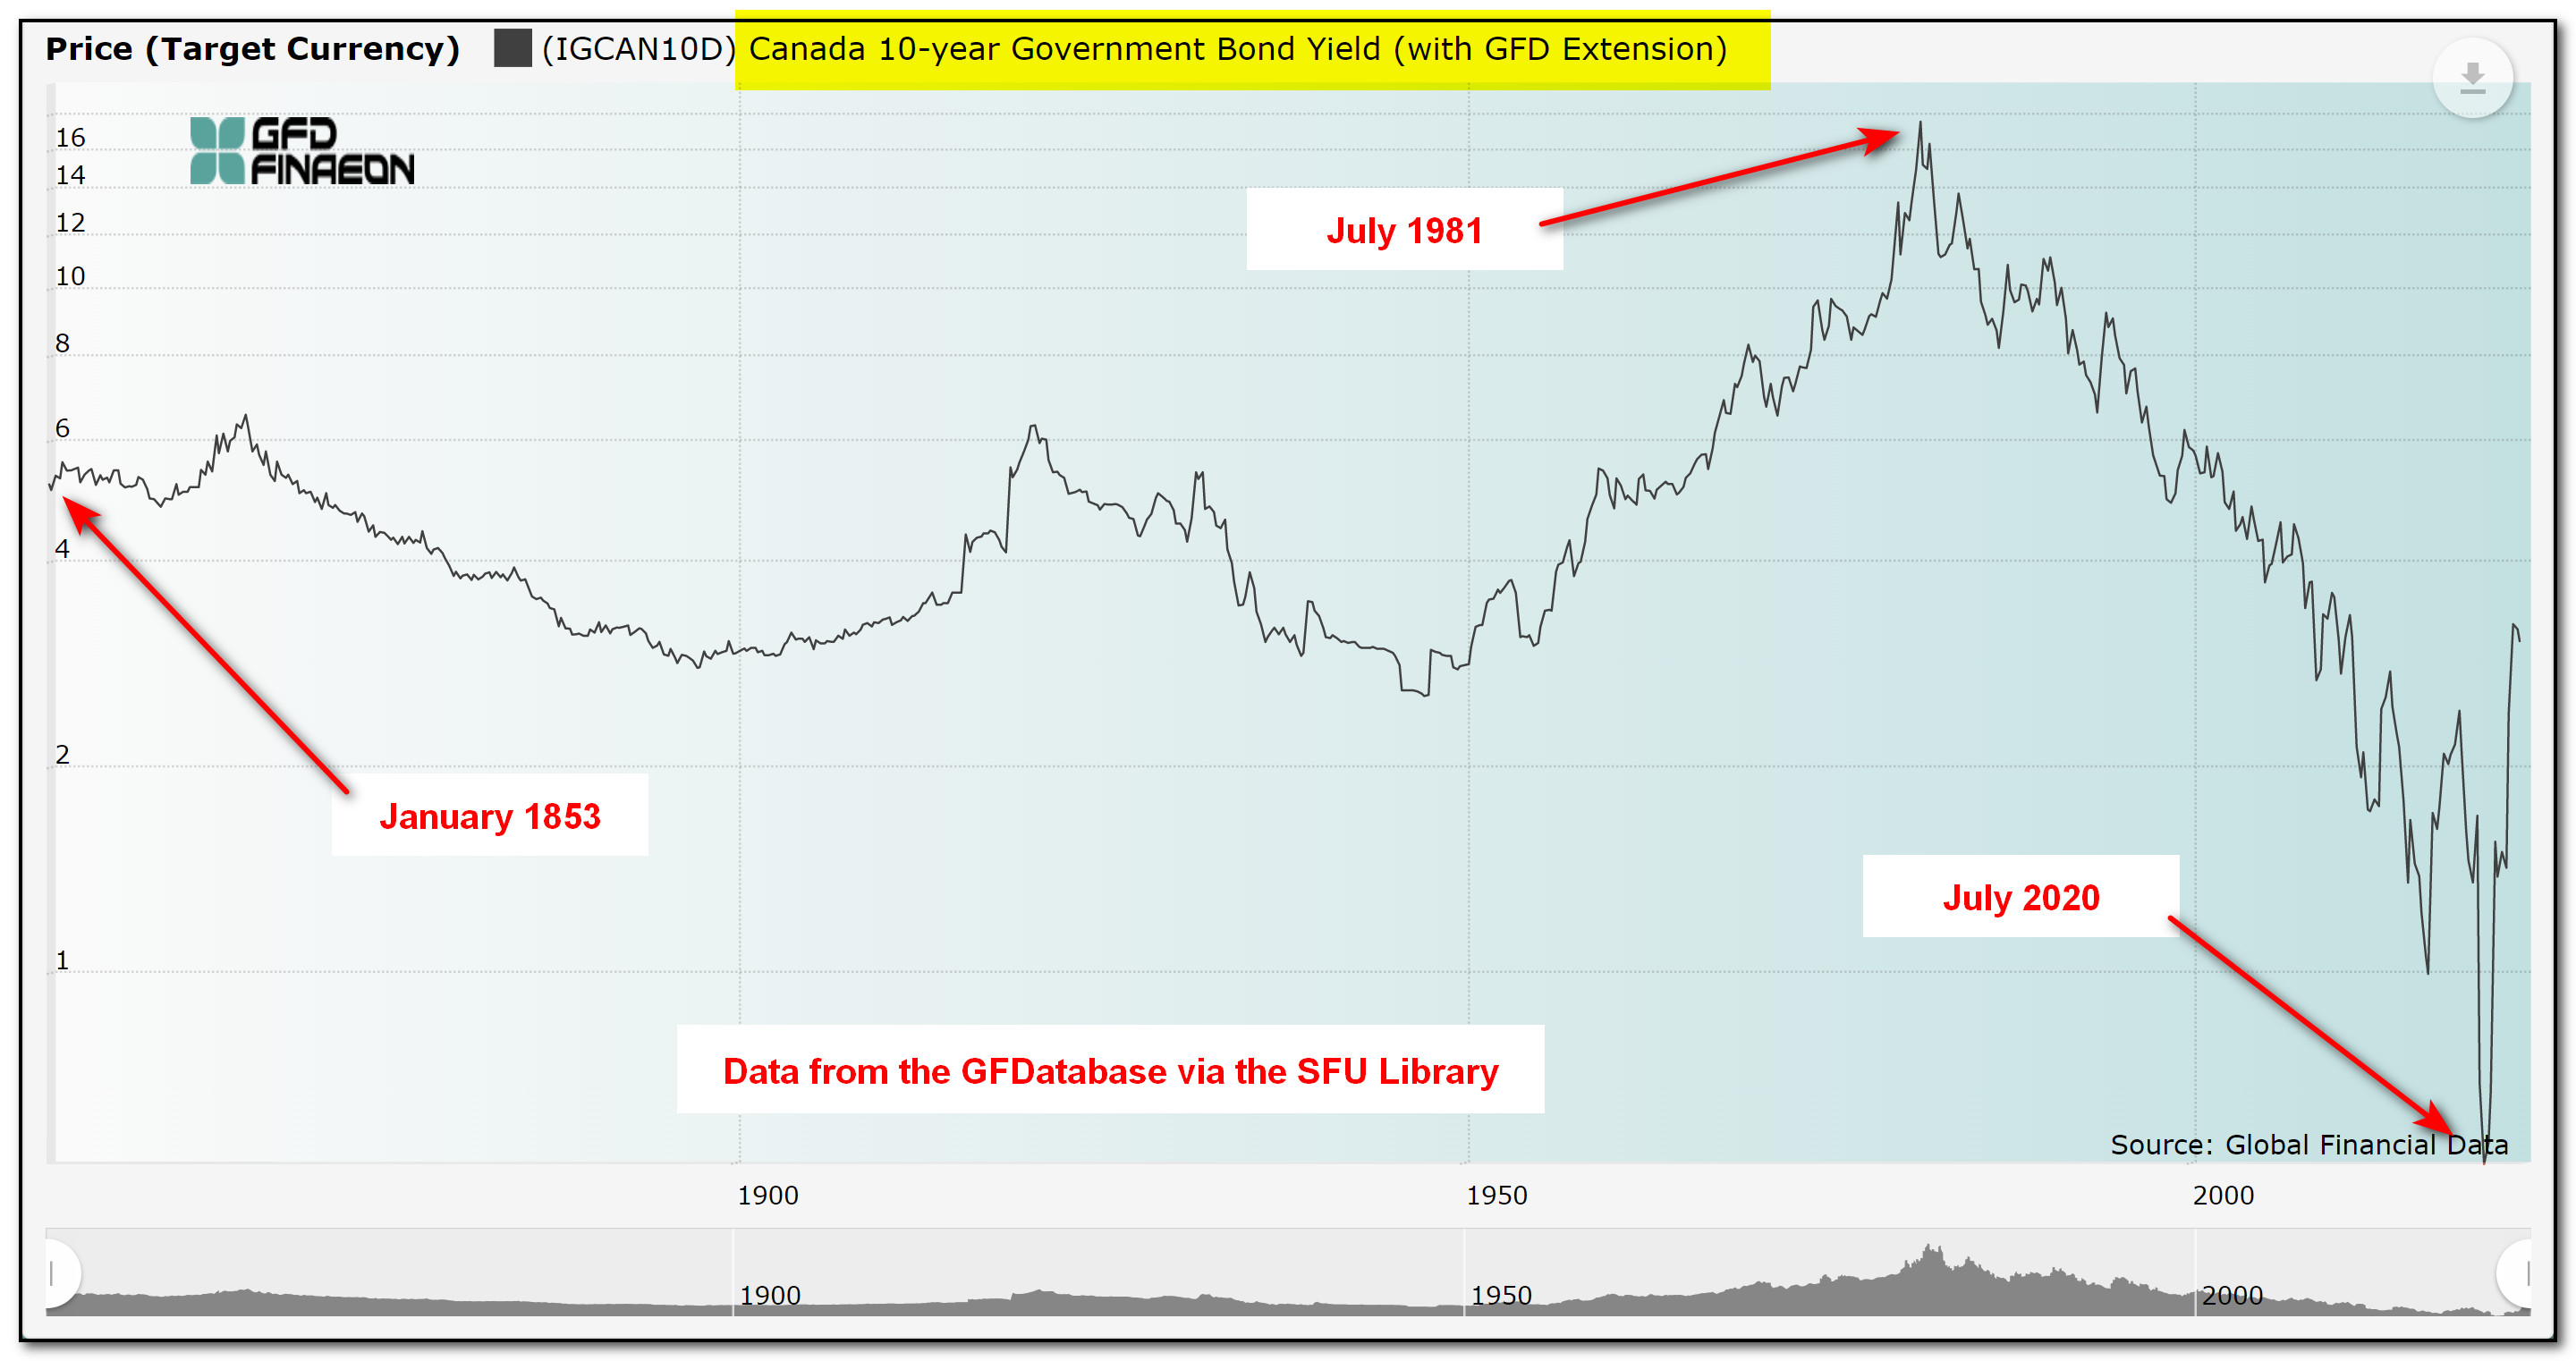
This time we have a very wide-angle view... almost 170 years! We still see a deep trough in July 2020, but now we see that the downward trend began way back in 1981, during the recession of the early 1980s. That is, we started sliding down that hill much earlier than 2001.
Moreover, the peak of 1981 was also anomalous — the result of a long, post-WWII trend upward in yields. Prior to WWII, the rate generally floated in the 3-6% range for almost a hundred years. I'm sure my economist colleagues could weigh in with all sorts of analysis about what these shifts mean (I'm just the librarian!), but my point is that you can't do such analysis if you don't have the data, and you may not even ask the questions if you don't have a nice, clean, long-range chart like this poking at your imagination.
Here's another example: let's look at an indicator that's in the news every day... our inflation rate. A quick scan of data from the last 22 years (via Statistics Canada), makes it look like the current increase in prices is extreme and even unprecedented:
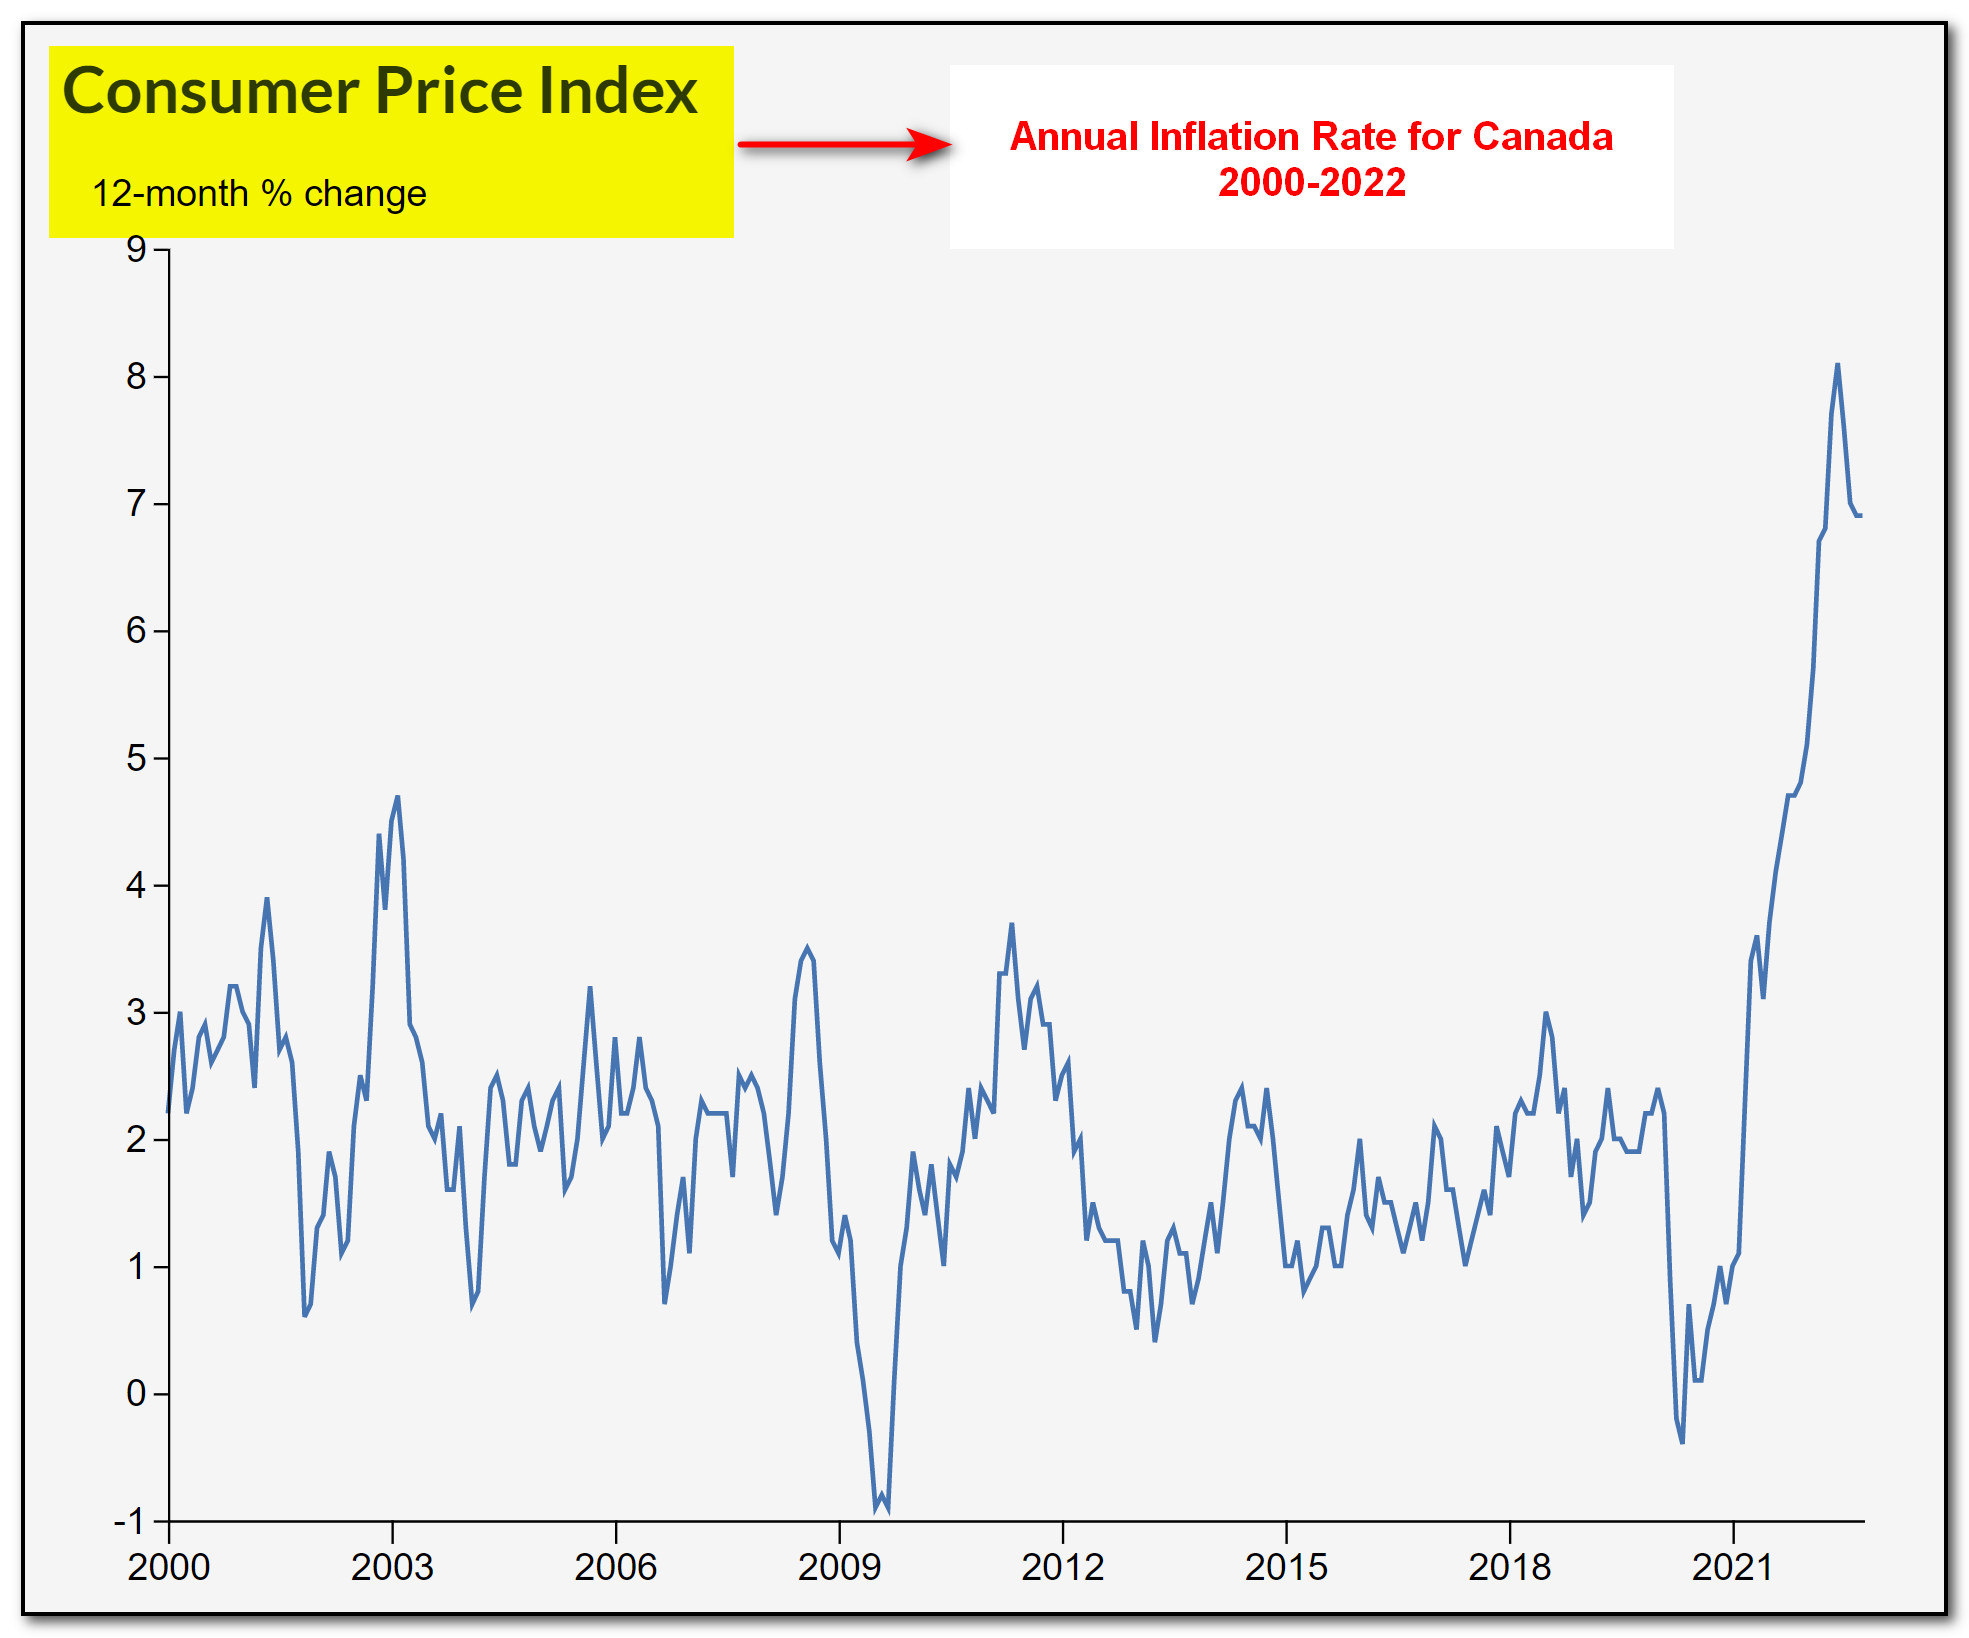
We now know that too much focus on the present can be misleading, so let's zoom out to see the trend from 1914 to the present (also online via Statistics Canada):
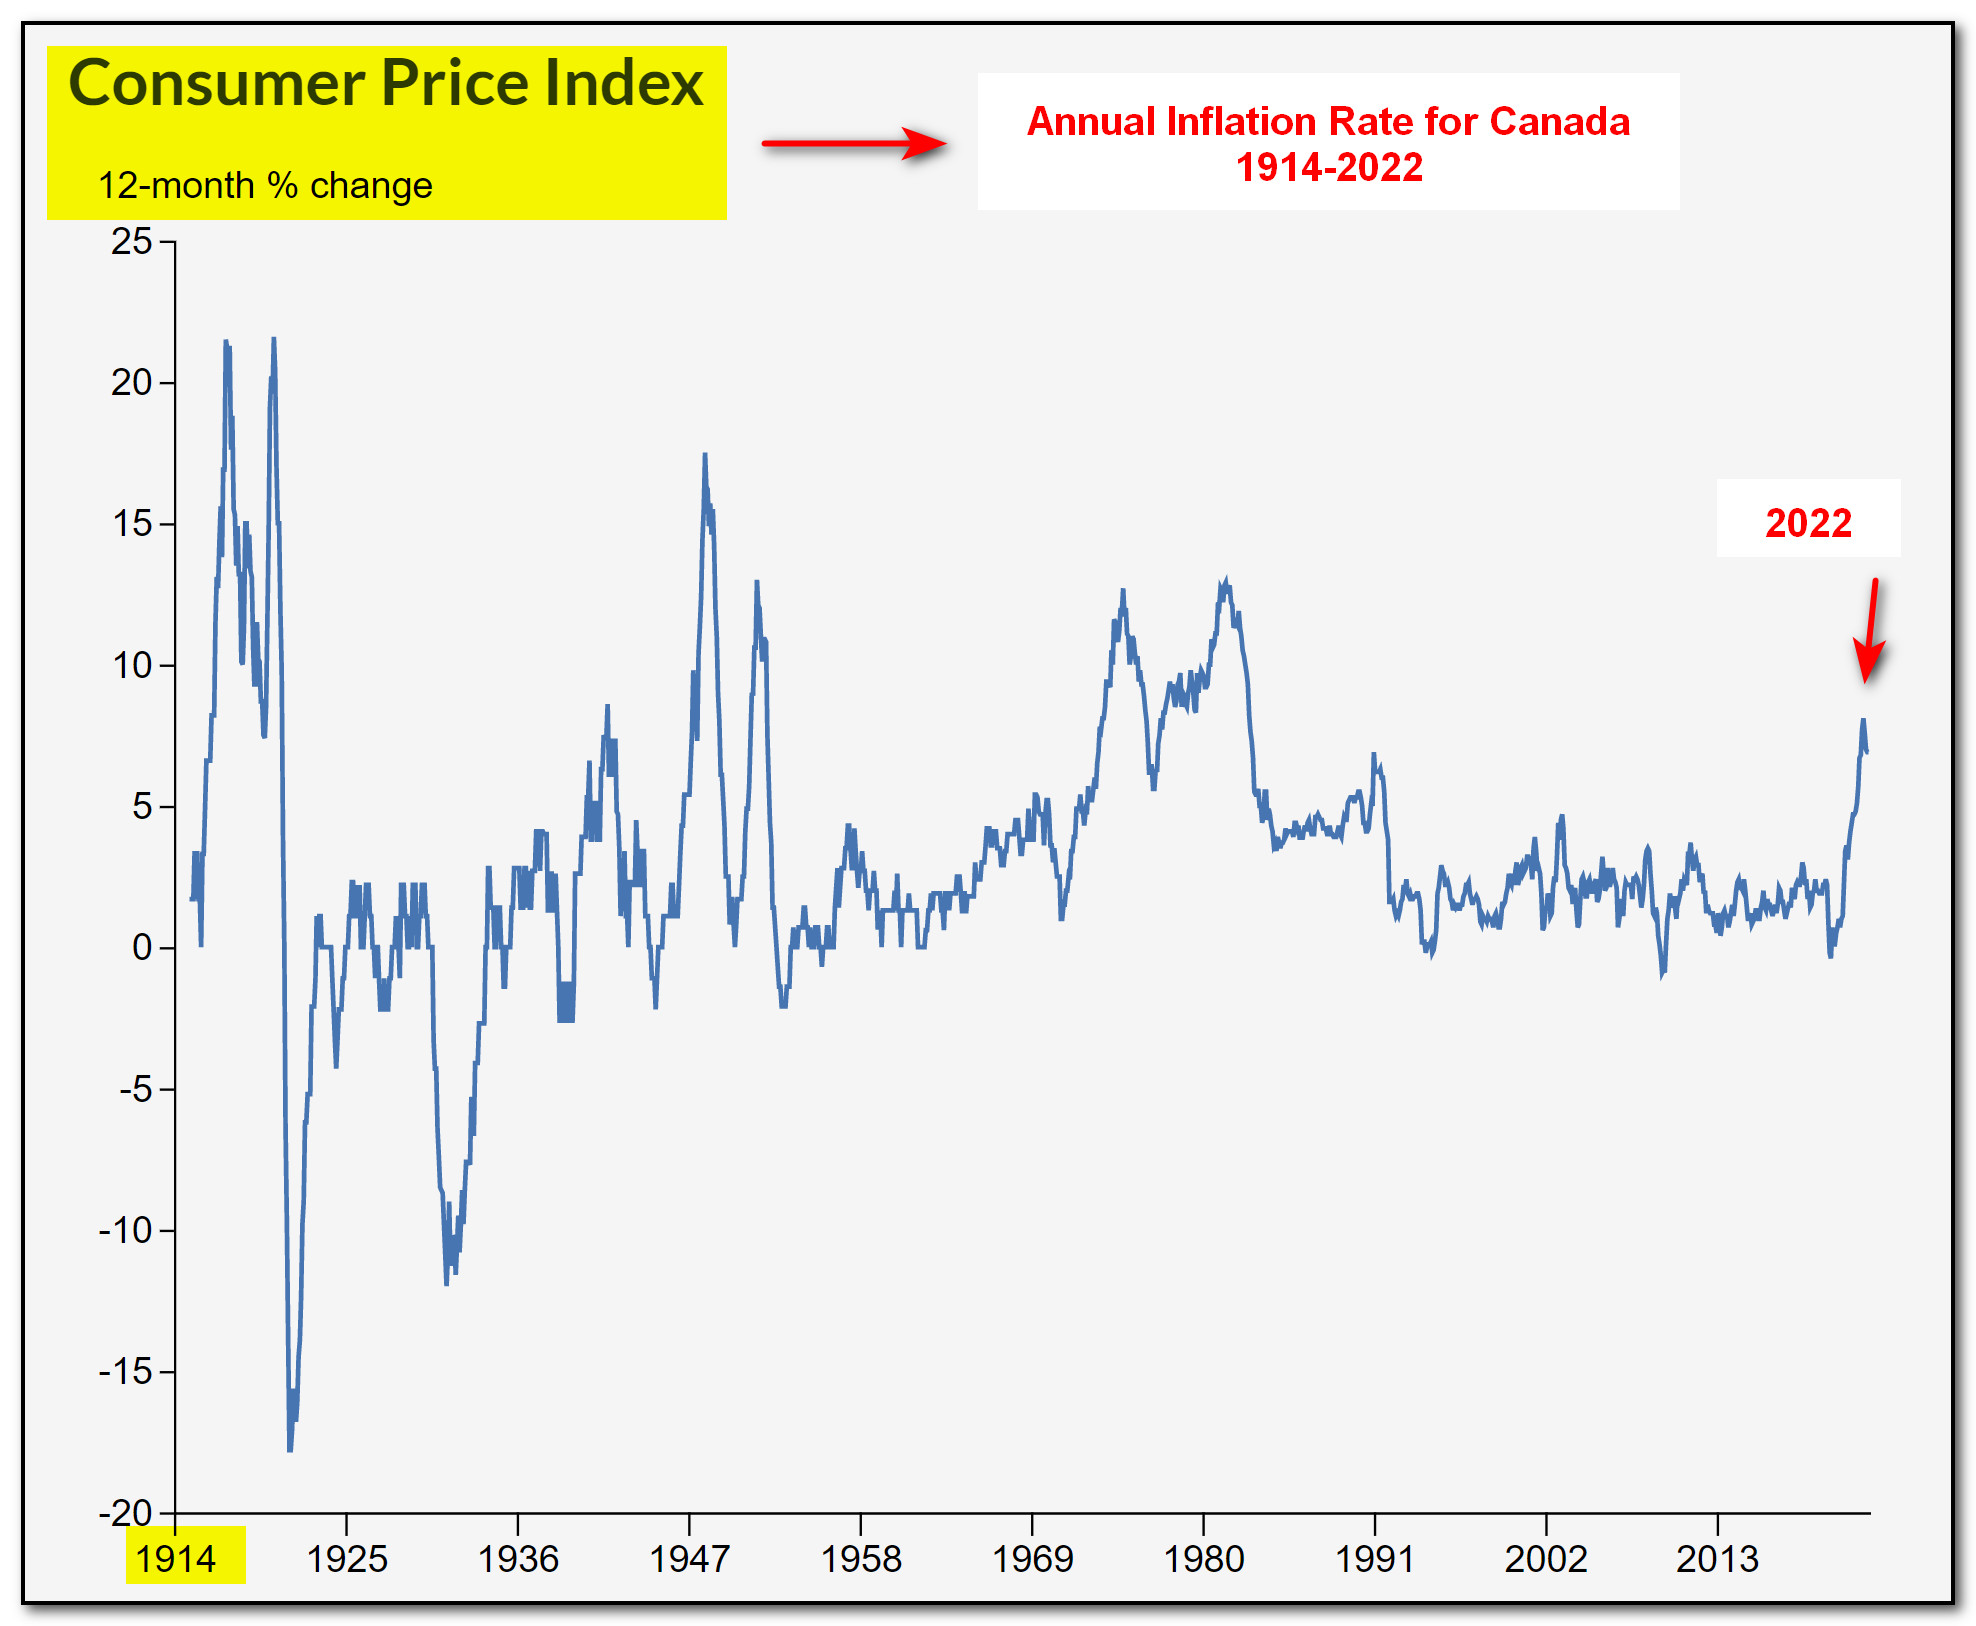
This time we see that the current high inflation rate is only unprecedented in the last 40 years, and we see much wilder variation in prices prior to WWII. But if we can learn all this from 100 years of data, perhaps there are lessons to be found in even longer time series... for instance, 260 years via GFDatabase:
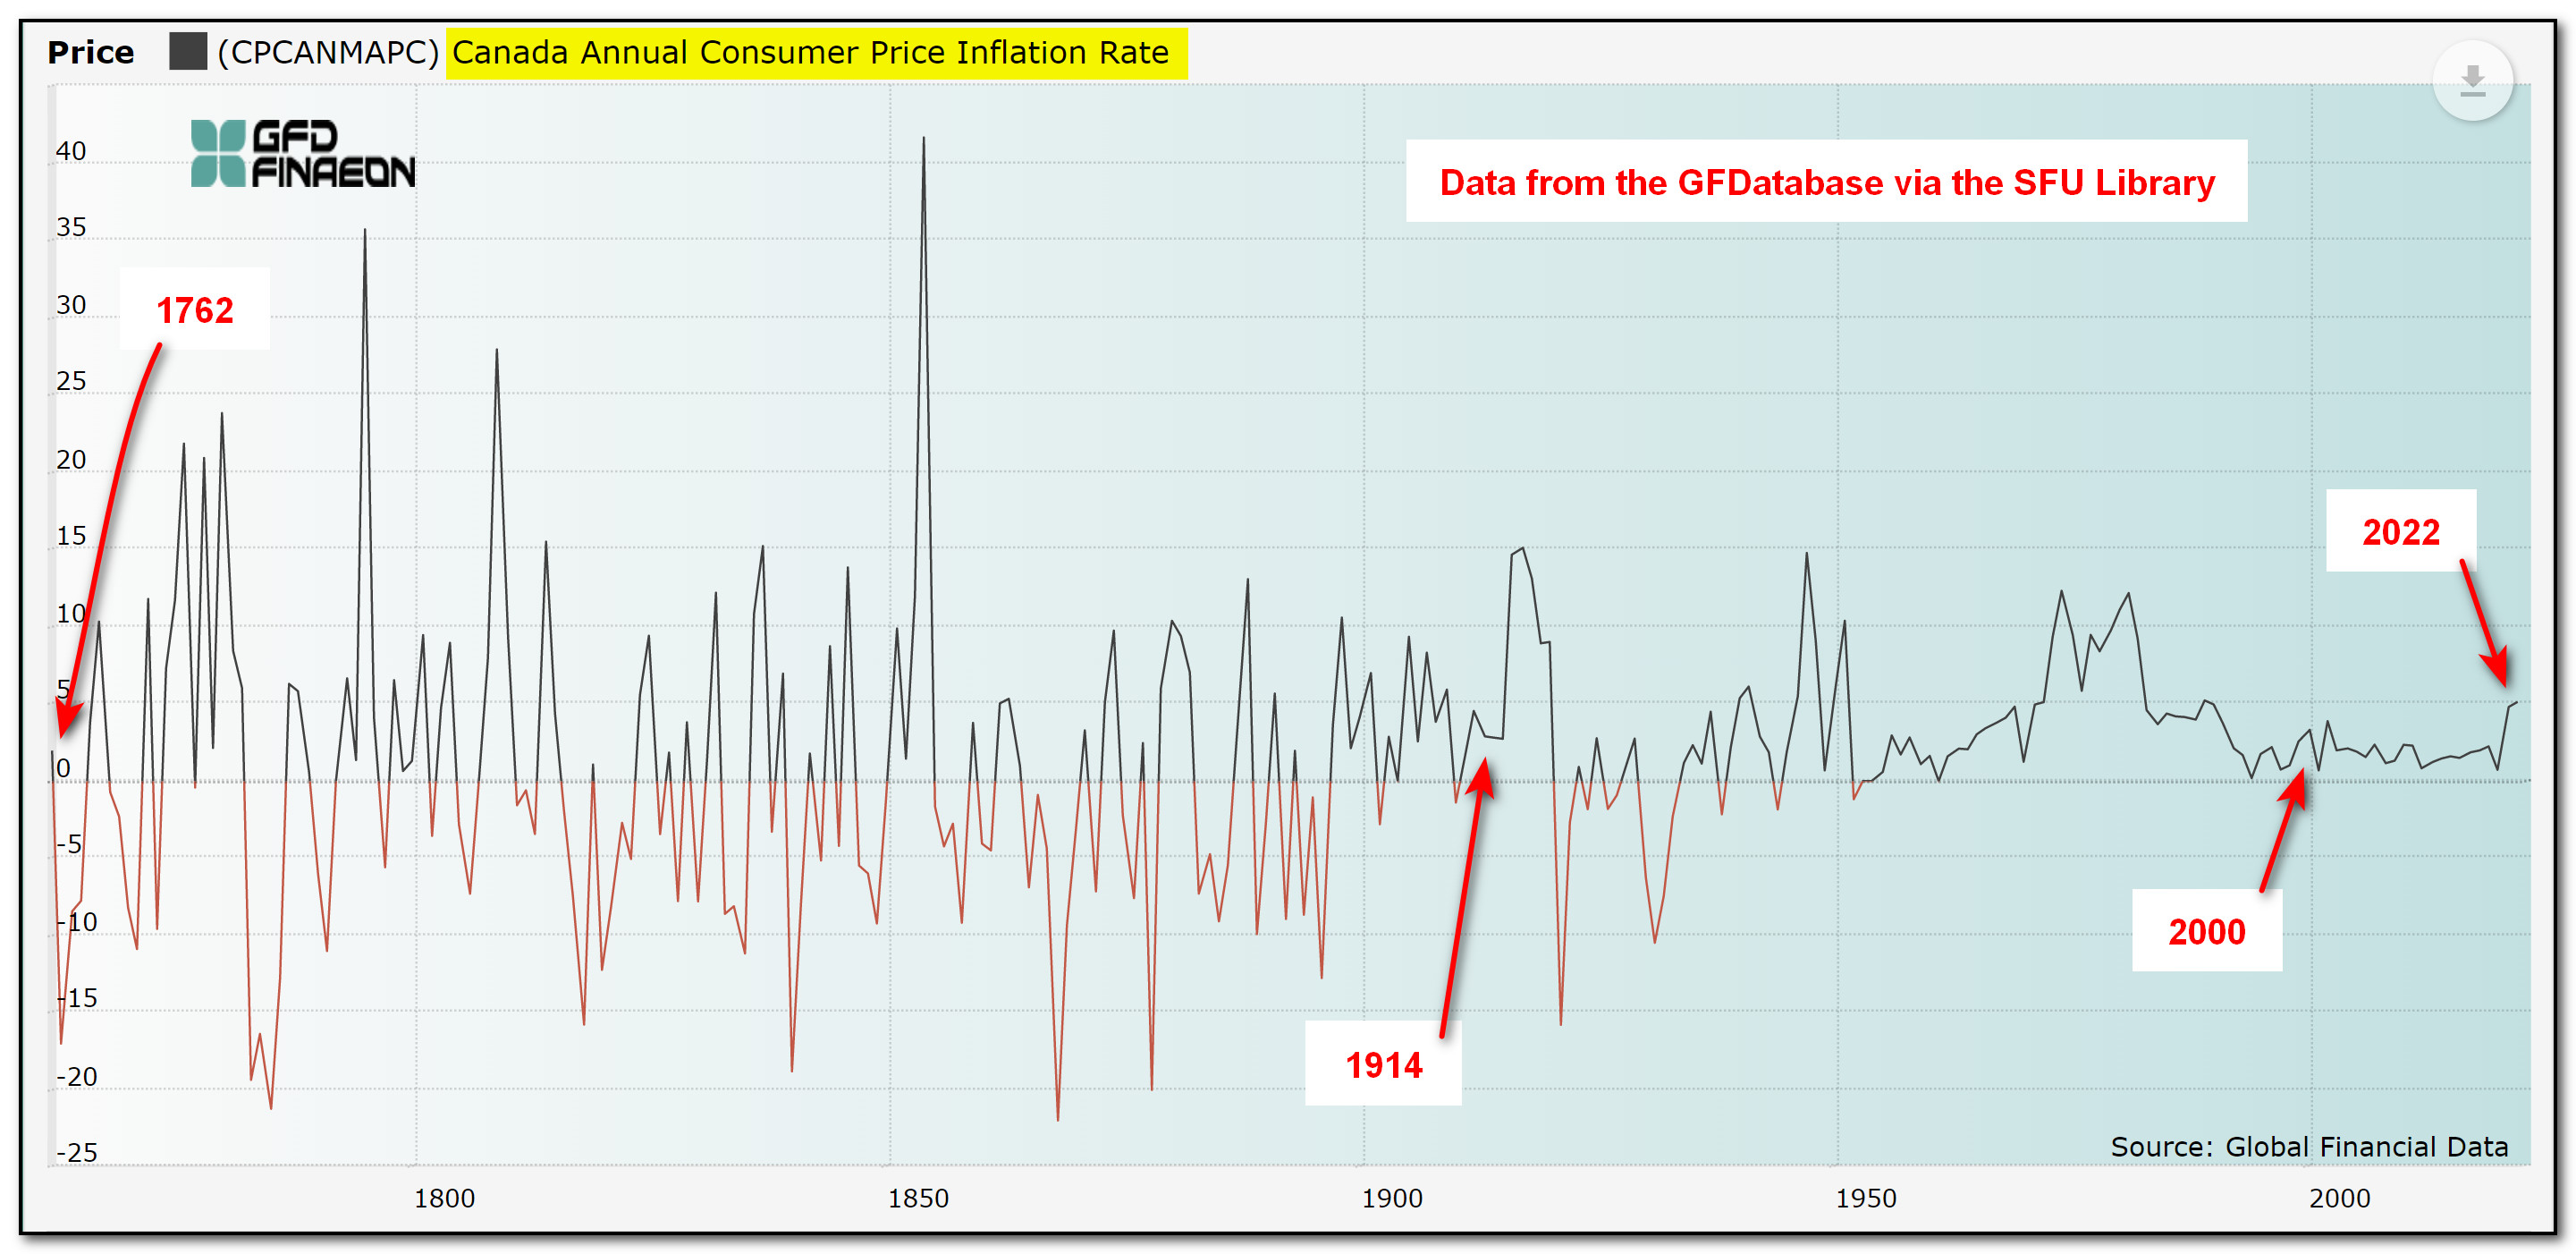
Hmmm... now we see that even the wild swings in prices early in the 1900s were moderate compared to the 150 years prior to that! The relative stability of the last 20 years has been the anomaly, not the current peak! What caused the previous increases and decreases? Why have the periods of deflation seemingly disappeared in the last 70 years? What calmed the waters and flattened the curves in this millennium? How did the yo-yo price changes affect people and businesses before this? How did they cope? What lessons can we draw from this that might help us understand our current situation?
Again, I'm not the subject expert, so I can only scratch the surface with my questions, but even I can see that there are some interesting (and perhaps illuminating) lessons in such a long-range view. Explore GFDatabase yourself to put our present into perspective!
Feedback needed!
Our subscription to GFDatabase is still in a "pilot" phase. We are evaluating its value to SFU research and assignments before committing to a continuing subscription. Given its nature, the database is unlikely to ever have the usage levels of a resource like Statista, but we believe its unique content potentially makes it a high-impact source.
It's been renewed to Dec. 31, 2023, but we need your feedback to make an informed decision about renewing it for 2024 and beyond.
- Did you use GFDatabase in a course as either a student or an instructor?
- Did you use GFDatabase in a research project that ended up being published?
- Did GFDatabase have data that you couldn't find elsewhere?
Please send any comments to mbodnar@sfu.ca by Sept. 15, 2023. Sooner is better!
— Mark
--------------
Mark Bodnar
Economics & Business Librarian
mbodnar@sfu.ca
P.S.: If you like historical business & economics sources, check out Mergent Archives and this list of online major news sources with content ranging back to the 1800s in many cases (both via the SFU Library).
P.P.S.: For more on GFDatabase, see this blog post: Using long-term cycles & precedents to understand current rates & returns: GFDatabase in action

