

A current awareness resource for students & faculty members in Business & Economics
What do cigarettes, golf, sugar, and energy distribution have in common?
Published by Mark BodnarI just received the latest usage report on our Statista database and thought I'd share some interesting trends:
During the month of October, SFU researchers used Statista to:
- view almost 5000 charts, topic reports, dossiers... more than 160/day;
- download over 580 images, slides & documents; and
- research topics ranging from golf (one of the BUS 360W cases assigned this term) to smartphones, confectionery, crime, and far, far beyond.
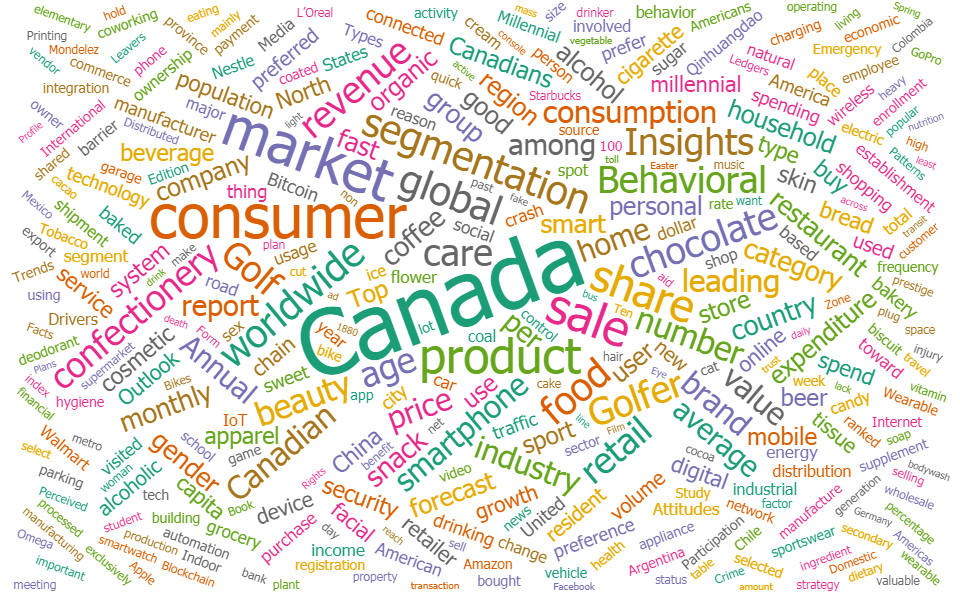
- See the word cloud below for the terms that came up most often in the titles of the reports & charts downloaded from Statista here at SFU last month.
If you haven't tried Statista yet, check out my earlier blog posts that mention this useful searching tool.
-- Mark
~~~~~~~~~~~~~~~~~~
Mark Bodnar
Business & Economics Librarian
mbodnar@sfu.ca
* Note: The word cloud above was generated using https://wordsift.org/ -- a project created, developed, and maintained at Stanford University.