

A current awareness resource for students & faculty members in Business & Economics
Useful little boxes: The power of psychographic clusters
Published by Mark Bodnar
But what if you change the "or" of my first sentence into an "and"?
My middle-aged, middle-income, ethnically diverse, and environmentally conscious household-with-teens is probably more similar to other households that tick all of those boxes than it is to a random Canadian household. And if we add a few more variables to the mix -- say... education level, occupation type, and leisure habits -- the definition gets more focused, and the in-group similarity rises.
This argument is at the root of the concept of psychographic clusters -- pre-set clusters of various demographic and psychological variables that serve as a functional shorthand for those who need to design and deliver services, messages, or products to specific parts of the population. Having "all university-educated Canadians" as a target is probably too broad to be useful, but if you instead aim for "university-educated families with young children who live in dense urban areas," then you will have a much simpler task.
Making your work even easier is the fact that these clusters of similar people tend to live near each other. In fact, the Globe & Mail published an article on exactly that topic: In Canada, you are where you live, population profiles say. (Here's a link to an SFU-only version of that article if the first link doesn't work for you.)
Great - but where can you get more information on these cluster things?
As the G&M article mentioned, one of the main systems of psychographic clusters in Canada is developed and used by Environics Analytics: Prizm5.
- Check out Environics' Prizm5 Lookup tool to find out which cluster is most common in your neighbourhood. (Flash required.)
- See this Quick Reference Guide to PRIZM at the Environics site.
- Check the Support/Data Documentation area in our SimplyAnalytics database for more information about PRIZM.
So... now that you know what clusters are, I bet you're just itching to use them! Maybe you want to find out which neighbourhoods in Metro Vancouver have the highest percentage of "New World Symphony" people? Or which cities in Canada have the most "Urban Elite"?
For that sort of information, you'll want to check our SimplyAnalytics database!
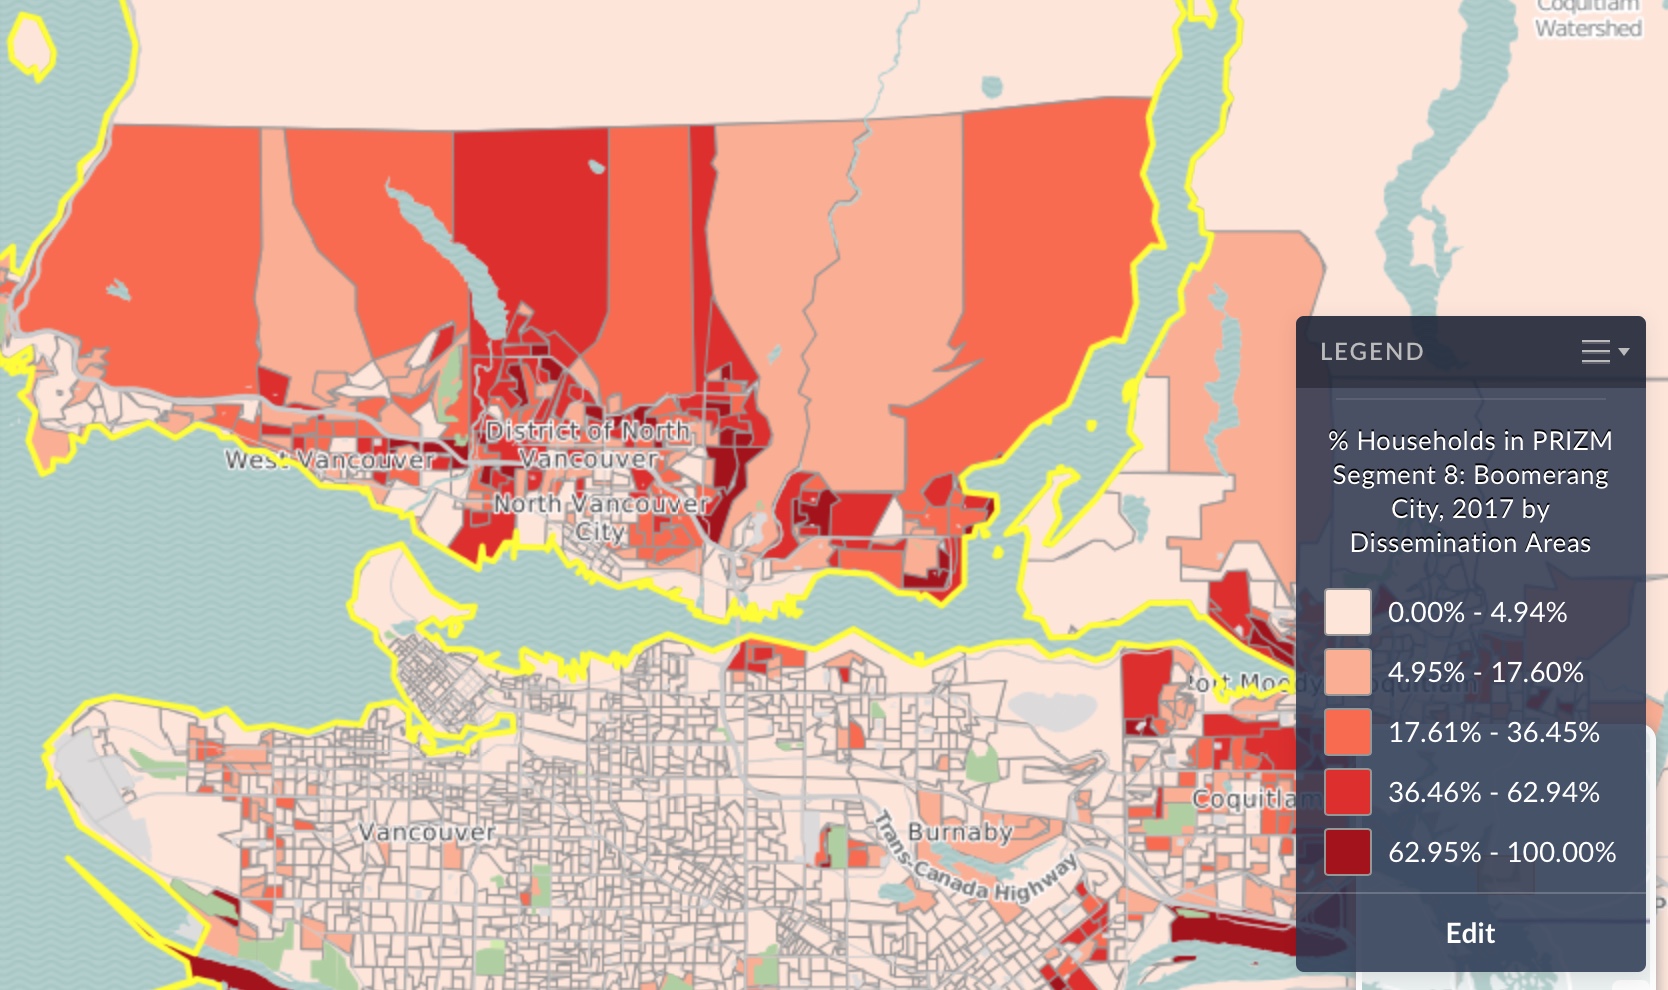
Here, for example, is a map of parts of Metro Vancouver, colour-coded to show the density of "Boomerang City" residents (click to enlarge):
Note: On your way into the database, consider registering (free) for a personal account so that the database will remember which projects you have open between sessions. If that's not a concern, choose the "Guest" option -- there's no cost since we've already paid for the SFU subscription.
Questions? Send them my way!
-- MarkB
~~~~~~~~~~~~~~~
Mark Bodnar
mbodnar@sfu.ca
Economics & Business Librarian