
What is Canadian Census data?
Canadian Census of Population (hereafter Census) provides a detailed statistical portrait of Canada and its people by their demographic, social and economic characteristics. For more details, refer to the SFU Library's Guide on the Canadian Census.
Why map Census data?
Thematic maps (meaning maps concerned with a particular theme or topic of interest) as opposed to reference maps (meaning maps designed to deliver location information) are often used to represent Census data visually. A thematic map based on Census data can bring hidden spatial patterns visibile. It is also a good communication tool.
How to map Census data?
Approach 1: Using a GIS program (i.e. QGIS, ArcGIS)
Refer to this documentation, which will teach you how to download Canadian census data from a Library database called CHASS Census Analyzer, download geographic data from Statistic Canada, prepare data in GIS, and display geographic information in a final map. Specifically, the steps will include:
- Downloading census data from CHASS
- Downloading census geographies from Statistics Canada
- Preparing geographic data in QGIS
- Base maps in QGIS using QuickMapServices
- Join data by Geography
- Calculate percentage of population with postsecondary education
- Change Map Symbology
- Create Map Layout and Publishing a Final Map
The end product is a map like this:
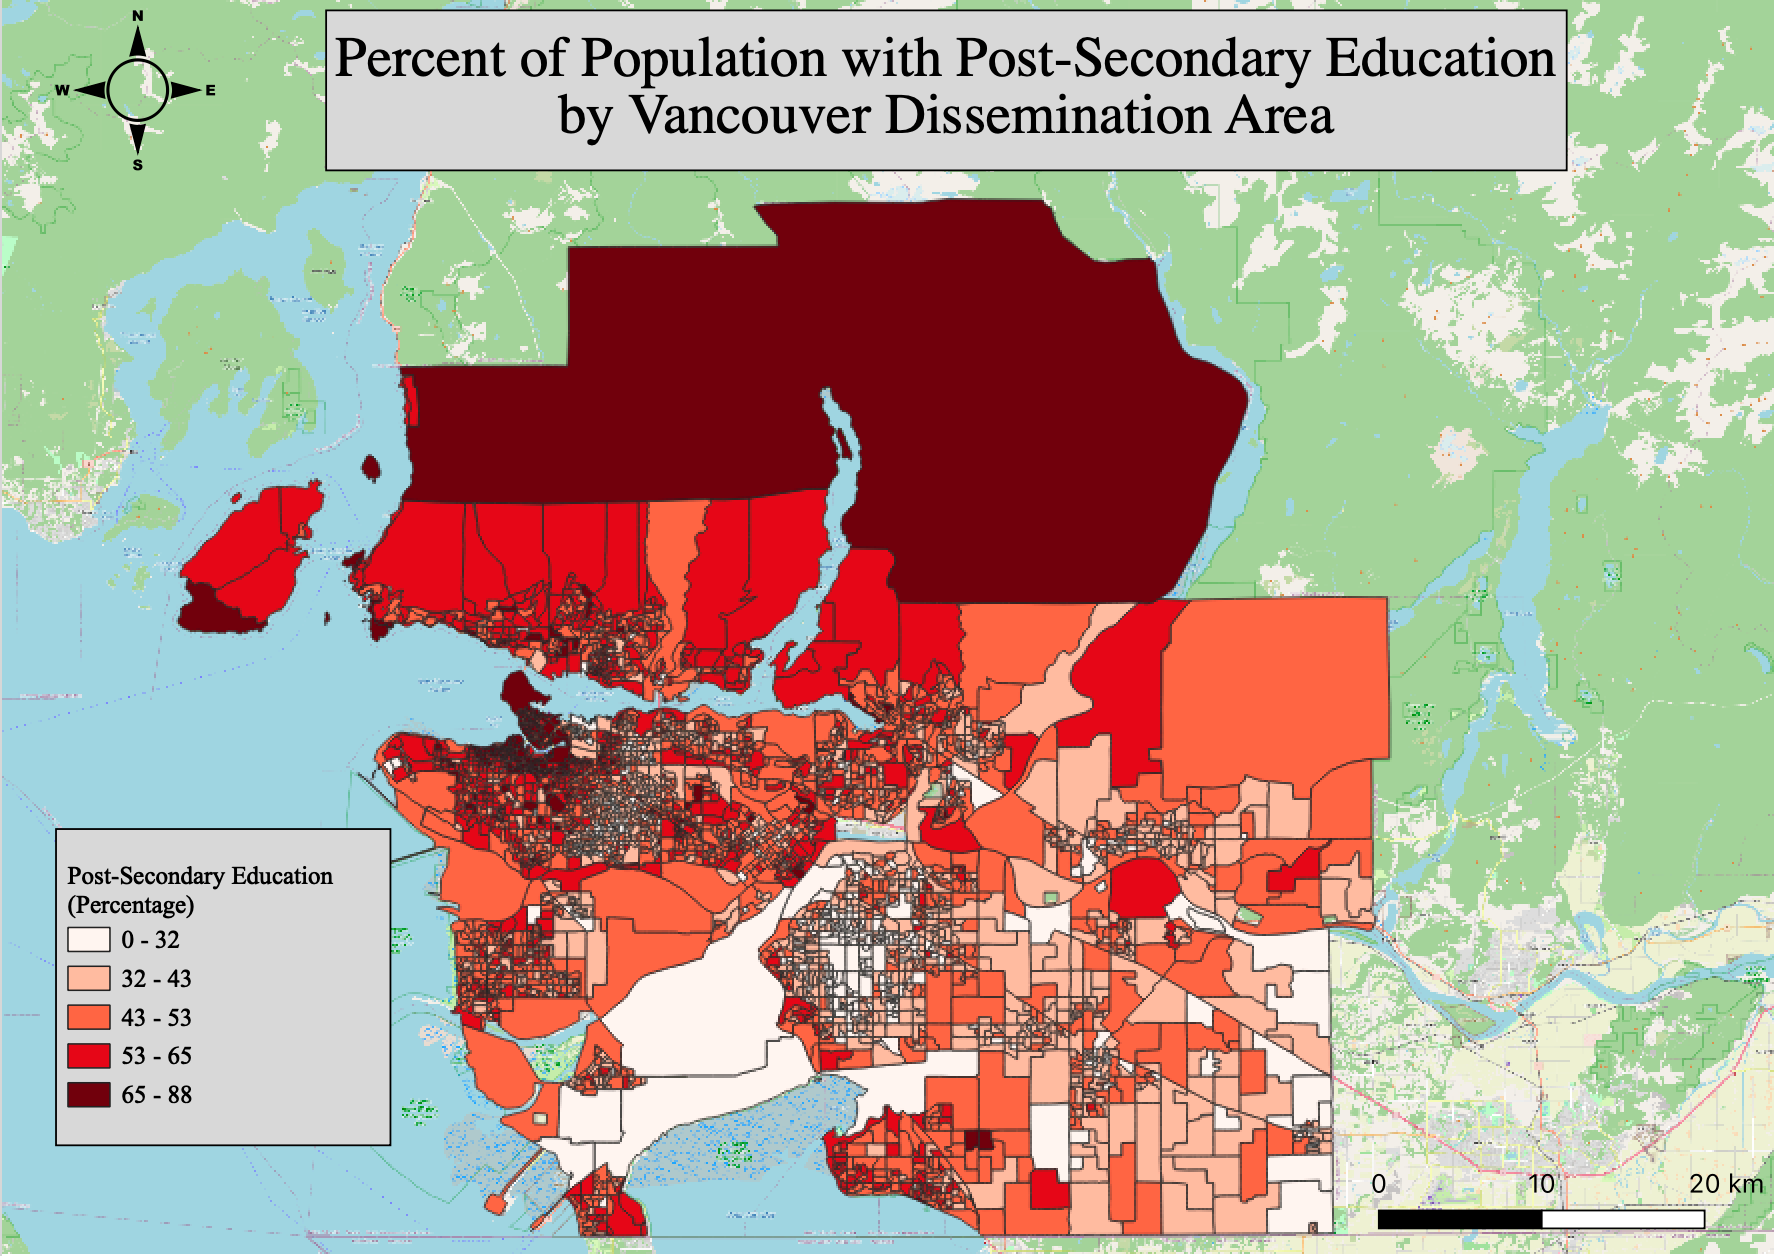
Thematic Map: Percent of Population with Post-Secondary Education by Vancouver Dissemination Area (2016 Census Data), created by Tanner Noth
Approach 2: SimplyAnalytics Canada (SFU sign in required)
SimplyAnalytics Canada (formerly SimplyMap Canada) is a web mapping tool used for creating thematic maps and reports using Canadian demographic, business, and consumer data sourced from publishers such as Statistics Canada, Environics Analytics, and Dun & Bradstreet.
This tool is useful for making quick maps drawing on the data (i.e. Canadian Census data) embedded in SimplyAnalytics. Using SimplyAnalytics to make a thematic map is much easier than Approach 1, but be aware that there are some limitations that come with this approach. For example, you may not be able to customize the data the way you want.