Dates
Tuesday, October 15, 2024 - 12:30pm to 4:30pm
Location
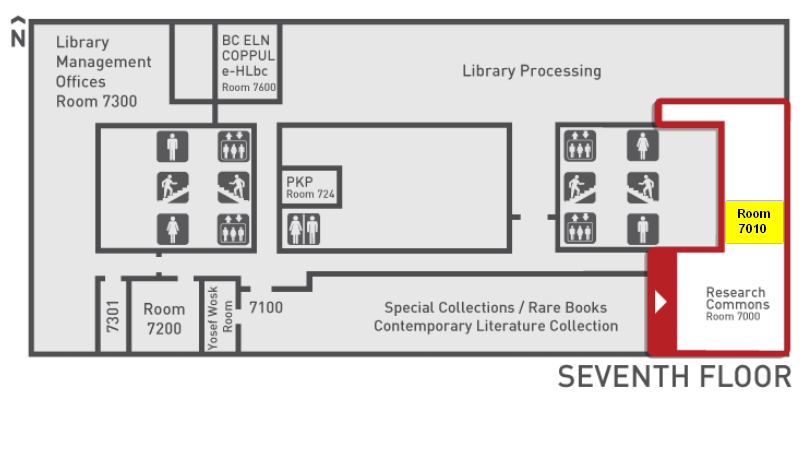
Burnaby, Bennett Library, Rm 7010, Research Commons
This workshop is in the past and registrations are unavailable.
Registration dates
closed Monday, October 14, 2024 - 6:00am
If you register and then realize you cannot attend, you must cancel by Thursday, October 10, 2024 - 11:59pm to avoid a $25 non-attendance fee applied to your library account in accordance with SFU Library's Cancellation Policy.
All times are Pacific Time Zone (Vancouver, BC, Canada).
Data visualization is the process of graphically representing data. Visualizing data allows you to draw insights, find patterns, as well as define and test models which might be difficult to create by observing raw data only. There are a number of R packages which help you with numerous types of visualizations.
By the end of this workshop you will be able to use R to create 2D scatter plots, bar charts, and box plots, and use R functions to ease the process of finding linear relationships and models using data provided throughout the workshop. Additionally, you will learn about selecting appropriate colour palettes for your plots. Depending on interest and time, we will explore adding interactivity to your plots.
Requirements
- Bring your own laptop, with the latest version of R and RStudio installed
- Familiarity with R and the RStudio environment including an understanding of basic functionality such as object assignment, data structures, and running scripts
Required libraries
- ggplot2,
- patchwork,
- RColorBrewer,
- ggiraph (if time permits).
Facilitator(s)
Fereshteh Rashed
Louis Arsenault-Mahjoubi
Category

