
On this page
- Introduction to PCensus
- Using PCensus at the Library
- Reference maps
- Census terminology
- Getting started
- Printing, exporting, and saving your work
- Citing PCensus reports, MapPoint maps, and other products
- Sample research exercises
- Additional resources and search aids
- Sample reports from previous PCensus versions
Introduction to PCensus
PCensus integrates census data and mapping software which allows for unique and flexible ways to examine demographic data and generate reports. It also features the capability for side-by-side census tract comparisons. Currently, the SFU Library runs Version 8.73, which operates in conjunction with the mapping software MapPoint. The PCensus databases contain primarily Canadian census data, as well as some United States data. The data available includes:
- 1981-2006 census data for Canada, the Provinces, and all Census Subdivisions
- 1981, 1986, 1991, 1996, 2001 and 2006 data for all B.C. Enumeration Areas to the Census Tract (CT)level
- 1991, 1996, 2001 and 2006 data to the B.C. Forward Sortation Area (FSA) level
- Population data from the 1990 and 2000 United States Census
A significant advantage of PCensus over other census products is that it provides all of the Canadian census data (both 100% and 20%) in one convenient list. Using PCensus, you can easily:
- Compare two or more census areas (i.e. Vancouver and Victoria) and get the data in a side-by-side display.
- Compare the same area across all census years (note: comparisons of different census years cannot be done in side-by-side display. You must do each census year separately).
- Create your own area, by radius, polygon, or driving time.
- Print your file or save it as an Excel file, an ASCII text file, an HTML file or as a comma-delimited ASCII file, which allows for data exporting to spreadsheets.
PCensus is also the only census product which provides data at the Dissemination Area (DA) or FSA - first three digits of a postal code.
PCensus is particularly useful for certain Business and Geography assignments, though other disciplines working with statistics, census information, and/or maps may also find the program functions useful. In addition to the features described above, PCensus is useful for projects where you need to:
- Create sales territories and make market evaluations and comparisons based on the demographic information from specific geographic locales.
- Use demographic information to research prime business locations and target potential customers.
- Create demographic maps for use in Word documents, PowerPoint presentations, and other visual presentations.
- Create maps from data stored in Microsoft Office Excel, Office Access, Office Outlook, SQL Server, or other database sources. Do note that this is a more complex task that will require some practice and time working with the MapPoint and PCensus programs.
For more information on the research and specific tasks possible with PCensus, please see Sample Research Exercises. A print version of this guide is also available for download.
The specific demographic databases available in PCensus include:
- 2001 Canada Census (Provinces)
- Canada 2001 Census: British Columbia
- 2001 Census (British Columbia)
- 2006 Census, Release 3 [British Columbia] (Canada, Provinces)
- 1981 Canada Census (Provinces)
- British Columbia 1981 Census 2A & B (EA)
- 1986 Canada Census (Provinces)
- British Columbia 1986 Census 2A & B (EA)
- 1991 Canada Census (Provinces)
- British Columbia 1991 Census 2A & B (EA)
- 1996 Canada Census (Provinces)
- Canada 2001 Census (Canada, Provinces)
- 1990 STF1A: United States (Standard)
- 2000 SF1+ [United States]
- 2000 SF3+ [United States]
- World Population
Note: Some of these database templates are not supported by PCensus version 8.73, and you will receive error messages. Please contact a librarian if you encounter difficulties with a specific template.
Using PCensus at the Library
PCensus is only available on a standalone computer at the Bennett Library in Burnaby, which is bookable online online (Standalone 2). Microsoft Excel is installed, however there is no internet connection or word processing available at this workstation. You will be able to print, but have to bring an USB drive in order to save your work electronically.
Do note that other census products are available for your research needs. Please consult our online library guide Which Census Product Should I Use? for information on choosing the right census product for your project.
Reference maps
Eight maps of the Vancouver CMA are included here as references for finding CT numbers. To find the CT number of the area you wish to study, first consult the main Vancouver CMA map and then, if necessary, select the appropriate inset map; these inset maps detail the more densely populated Vancouver areas.
- Vancouver CMA (1/8)
- Inset 1 (2/8) – West Vancouver/North Vancouver
- Inset 2 (3/8) – Burnaby/Coquitlam/Port Coquitlam/North Surrey
- Inset 3 (4/8) – Vancouver
- Inset 4 (5/8) – Pitt Meadows/Maple Ridge/North Langley
- Inset 5 (6/8) – Richmond/Delta
- Inset 6 (7/8) – Surrey/White Rock
- Inset 7 (8/8) - Langley
- Index of Electoral Districts (Canada FEDs)
Note: The CMA maps included here may differ from those currently available at Statistics Canada. For the most current map information, please consult the Statistics Canada website.
If you are studying a geographic area other than the Vancouver CMA, reference maps for the rest of Canada are available on the Canada Census website.
- From the left-hand menu, click on Geography
- Under Maps, click on Reference Maps for a list of options (Census tract maps by CMA/CA or
- Dissemination Area). Click on an option for both its description and to find a specific reference map.
Note: Not all available PCensus databases have all of the data for geographic areas outside of British Columbia.Federal Electoral District numbers can be identified by using the Index of Electoral Districts map that is also included in Appendix A. If you find this map difficult to read, it is also available online.
Census terminology
If you are unfamiliar with census terminology, here are some useful definitions that will help you understand both this guide and census information in general:
- Census Universes: Universes refer to what is counted. There are four universes: Population, Families, Households, and Dwellings. Census questions must relate to one of these four universes.
- Variables: Variables are symbols or terms to which numerical values can be assigned (e.g., age is a census variable). Some variables are based on 100% data and some are based on 20% data.
- 100% versus 20% Data: In a census year, most households (80%) receive a short census questionnaire, which is used to determine statics such as population, age, sex, and marital status; this is 100% data. The long census questionnaire is delivered to 20% of households and includes numerous additional questions on a variety of subjects, including education, ethnicity, mobility, income, and employment; this is 20% data.
- Dissemination Area (DA): A small area composed of one or more neighbouring blocks with a population of 400 to 700 persons.
- Census Tract (CT): A permanent, neighbourhood-like community located in a large urban area (>50,000), which generally has a population between 2,500 and 8,000. Census tracts are assigned numbers rather than names. Data from census tracts are good for local area analysis in urban planning, educational research, and market research.
- Federal Electoral District (FED): An area represented by a Member of Parliament (MP) elected to the House of Commons.
- Census Subdivision (CSD): A municipality or an area treated as equivalent to a municipality for statistical purposes (e.g., an Indian reserve or an unorganized territory). This is the level for finding data about an entire city such as Vancouver or Burnaby.
- Census Metropolitan Area (CMA): An area composed of one or more neighbouring municipalities with an urban core. A CMA has a population of at least 100,000.
- Census Agglomeration (CA): An area composed of one or more neighbouring municipalities with an urban core. A CA must have an urban core population of at least 10,000.
- Forward Sortation Area (FSA): The first three characters of a postal code. The average number of households that share the same FSA is 8,000, but the number can range from zero to more than 60,000 households.
The diagram “Hierarchy of Standard Geographic Units for Dissemination, 2001 Census” below illustrates the interrelationship of some of the above definitions
Source: Introduction to the Geography Section, 2001 Census, Statistics Canada
For more on census terminology and other census information, please consult Statistics - Canadian Census.
Getting started
PCensus operates in conjunction with MapPoint, and both programs should open simultaneously; many features of PCensus will not work properly unless MapPoint is also running. If MapPoint does not open at the same time, minimise the PCensus window and then open MapPoint by selecting it from the program menu.
Note: PCensus has a context-sensitive Help function, which provides detailed descriptions of all of the controls used in the program and provides links to other relevant information. You can also press F1 or click the Help icon on the tool bar.
PCensus is programmed to open to the Project Wizard: click on New Project. You will now see a list of options, and while your choice will depend on what you intend to do, for most exercises you will select the first or second option:
- Select a Predefined area: this option provides you with demographic reports based on standard geography-based, statistic gathering parameters. The available predefined areas depend on which database you are using, but generally include CMAs, CTs, FSAs, etcetera.
- Use a map to define polygon, circle, or drive time areas: this option lets you generate custom demographic reports by selecting geographic regions outside of the predefined areas (CMAs, CTs, FSAs, etcetera).
- Batch Sites – create circles/drive times from your database of site locations: in order to use this option, you must have a list of site locations, generally in the form of an address list within a database or spreadsheet, that PCensus can use to calculate drive times or create circles on a map. Without external data, you cannot use this feature. It is recommended that you discuss this type of project with a librarian or the Research Data Library before beginning such a project with PCensus.
- Sitescan – cover an area with a grid of sites to help determine the best site location: this is another advanced feature that allows you to analyze a large number of sites with the purpose of finding and ranking locations that best meet specific demographic criteria, such as a minimum population and income level within a specified distance/drive time. It is recommended that you discuss this type of project with a librarian or the Research Data Library before beginning such a project with PCensus.
Sample search:
The following steps outline the process for a simple search of one Vancouver Census Tract area. Begin by opening PCensus, then:
- Select New Project Wizard
- Click on Select a Predefined Area, then click Next.
- Select the 2006 Census, Release 3 [British Columbia] demographic database.
- The Select a Custom Data Template (if required) field is generally auto-selected based on the demographic database chosen, as is the case in this example.
- Select a Predefined Area Type. The available options will also depend on the demographic database chosen, and you will see a number of options for this search. Click on Census Tract (CT).
- A very long alphabetical list will appear. Type “Va” to skip to Vancouver. Select Vancouver, B.C., then click the CT button on the left.
- A columnar list of numbers will appear. Select the first one 0001.01. Normally, you would select the neighborhood from the Vancouver CMA map first, where the corresponding CT number is indicated. In this example, the neighborhood is comprised of the blocks in the 49th Ave, Marine Dr., and Boundary Rd. area, which is detailed in the CMA Map Inset 3. See the Reference Maps.
- Click Next, then Finish
- At this point, you have the option of renaming the Study Title. The default is the CMA number and CT number combined – keeping these numbers in your title is a good way to preserve a defined reference to the data in the subsequent report.
- Click Search Now.
The search generates a report entitled 2006 Census Snapshot, listing these categories:
- Census Snapshot (default display)
- Total Population
- Ages
- Average Age
- Families
- Households
- Occupied Dwellings
If you click on the 2006 Census Snapshot title tab, you will be able to select a report section with more detailed information on these categories. Note that you are also provided with graphs of the information, accessible by clicking on the Graph tab.
Tips: The ADD button in the Predefined Area Type selection box will allow you to combine the information from two or more geographical areas. Clicking on New Study Area on the menu bar and selecting New Predefined Study Area will take you back to the Step 3 (selection of a Demographic Database). Repeat the same steps and select another CT for a side by side comparison. You can use these same instructions to compare two or more provinces, CMAs or any other census geographical area. See Sample Research Exercise 2 - Combining the information from two or more Census Tracts.
See the Sample Research Exercises for a list of other tasks possible with PCensus.
Printing, exporting, and saving your work
PCensus can be a difficult program to use and is prone to errors if used improperly – which can happen accidentally. Print, export, or save your work as soon as you have obtained the information you need. You can always delete files later. You must use an USB device if you wish to export data files or save any part of a PCensus project.
Printing
When you are ready to print a report, click on File and select Print, and the Print Profile Report window will appear:
- You can add and/or change the Report Header titles
- Select Landscape or Portrait – up to 4 columns display well in portrait, more than 4 columns should be printed in landscape
- Layout Options - allow you to further customize the design of your report
- Check Categories to Print – select the categories by using the checkboxes
Note: If you print all categories, each one prints on a separate page. Some reports can result in as many as 75 pages of output. If you wish to have all data, it is best to save or export. You can also print the profile graphs and maps that are generated by PCensus. Click on the profile tabs to view the graphs or maps before selecting File and Print.
Exporting
Rather than printing, you can export the data from all or parts of a PCensus project. Insert your USB device, and while viewing the Profile Report, click on Export, then Export ProfileTotals. The export window will appear:
- Select the drive location of your USB device by clicking on Browse.
- Select the categories you wish to export; CTRL + click allows you to make multiple selections, or you can select All Categories.
- Select a file format:
- Excel Spreadsheet – saves the data directly into a Microsoft Excel spreadsheet.
- Comma Delimited ASCII – use when you want import data into database programs or spreadsheet programs like MS Excel.
- ASCII text
- HTML file - works well for viewing and/or printing at a later date.
- Add and/or change Report Header titles.
- Leave the checkbox View Created File selected to open the file after exporting.
- Click OK.
Saving
Saving a project will allow you to return to your work later to make additions or changes. To save a project, insert your USB device, then click on File and select Save Project As to bring up the Save As window:
- Rename the project under File Name
- Select the drive location of your USB device
- Click Save.
You can also save and export the profile graphs and maps that are generated by PCensus:
- Click on the Profile Graph tab to view the graph.
- Click on Export, then Export Graph as Graphic to bring up the export window.
- Select the drive location of your USB device.
- Rename the file if desired.
- Under Save as Type, select .bmp (Microsoft Bitmap).
- Click Save.
Follow the same steps for maps. See Sample Research Exercise 4 and Sample Research Exercise 5.
Citing PCensus reports, MapPoint maps, and other products
You must formally acknowledge your sources of information when using PCensus reports, MapPoint maps, and other statistical products. The following is a citation example of a Census Profile accessed through PCensus (Turabian style):
Statistics Canada. 2001 Census of Canada: Profile Data for Vancouver and Victoria at the Census Tract level. Ottawa, Ont.: Statistics Canada [producer]; Vancouver, B.C.: Tetrad Computer Applications [distributor], 2002. Accessed 26 August 2004. Available from PCensus for MapPoint [computer file], Simon Fraser University Library.
Note: PCensus census data is produced by Statistics Canada, but distributed by the Tetrad company.
MapPoint maps carry a Microsoft copyright. If you use maps generated from PCensus/MapPoint in your thesis, you will need written permission from Microsoft MapPoint.
Essentially, the copyright information must accompany the map and it may not be offered for sale, as copyright law prohibits copying a map for commercial publication. You should also refer to the license agreement that comes with MapPoint for more information. Please contact a librarian for details on SFU’s MapPoint license agreement.
For more detailed information on properly citing statistical information, see the SFU guide Citing guide for Statistics Canada, PCensus, EStat, and CHASS data.
Sample research exercises
This section provides step-by-step instructions for nine of the most common research tasks with PCensus, and concludes with a list of other possible research reports. Please read Section V: Getting Started as an overview before attempting any of the following exercises.
- Comparison of Two Census Tracts: Vancouver and Victoria.
- Combining the information from two or more Census Tracts.
- Using MapPoint to Create a Custom Study Area – Polygons
- Using MapPoint to Create a Custom Study Area – Circle
- Comparison of Household Income by FSA, with Exported Graph
- Family Structure and Children in the Vancouver CMA, exported and displayed as HTML
- Population summary comparison of LA and Seattle, exported as an Excel spreadsheet
- Canada/US Comparison – California and B.C.
- Population Comparison of Canada, United States, and Mexico
- Other Possible Research Data Outputs
1. Comparison of two census tracts: Vancouver and Victoria
- Select New Project Wizard
- Click on Select a Predefined Area, then click Next
- Selections:
- Demographic database: 2006 Census, Release 3 [British Columbia]
- Custom Data Template: default
- Predefined Area Type: Census Tract (CT)
- Click Next
- A very long alphabetical list of locations will appear. Type “Va” to skip to Vancouver. Select Vancouver, B.C., then click the CT button on the left.
- A list of Census Tract numbers will appear. Select the first one 0001.01
- Click Next, Finish, and Search Now.
- Your data will display in a columnar list. Click on Study Area on the menu bar and select New Predefined Study Area.
- Repeat Steps 3 - 7 , this time selecting Victoria and 0001.00 from the list of CT numbers.
- Click Next, Finish, and Search Now. A second columnar list will display next to your first selection.
- Click File on the menu bar and select Print
- Enter Comparison of Two Census Tracts: Vancouver and Victoria as the report header, and select 2006 Census Census Snapshot as the category to print.
- Select the appropriate printer, and click Print. Ask a staff member for assistance if your report does not appear in the print queue.
Note: Use the same instructions to compare two or more provinces, CMA's or any other census geographical area.
2. Combining the information from two or more census tracts.
- Select New Project Wizard
- Click on Select a Predefined Area, then click Next
- Selections:
- Demographic database: 2006 Census, Release 3 [British Columbia]
- Custom Data Template: default
- Predefined Area Type: Census Tract (CT)
- Click Next
- A very long alphabetical list of locations will appear. Type “Va” to skip to Vancouver. Select Vancouver, B.C., then click the CT button on the left.
- Click on Add Another (on the right of the box displaying your first CT).
- Select your second CT from the list: 0001.02
- Repeat steps 6 and 7 until you have accumulated all the census tracts you want. We will only combine CTs 0001.01 and 0001.02. Click Next, Finish and Search Now.
- Your data will display in a columnar list. This is the combined data from all CTs selected, as will be indicated in the column title.
- Click File on the menu bar and select Print
- Enter Combining the information from two or more Census Tracts as the report header, and select 2006 Census Census Snapshot as the category to print.
- Select the appropriate printer, and click Print. Ask a staff member for assistance if your report does not appear in the print queue.
Note: You can also use MapPoint to create a custom area, an option that will allow you to create a more particularly defined study area - especially by using Polygons. See the next exercise.
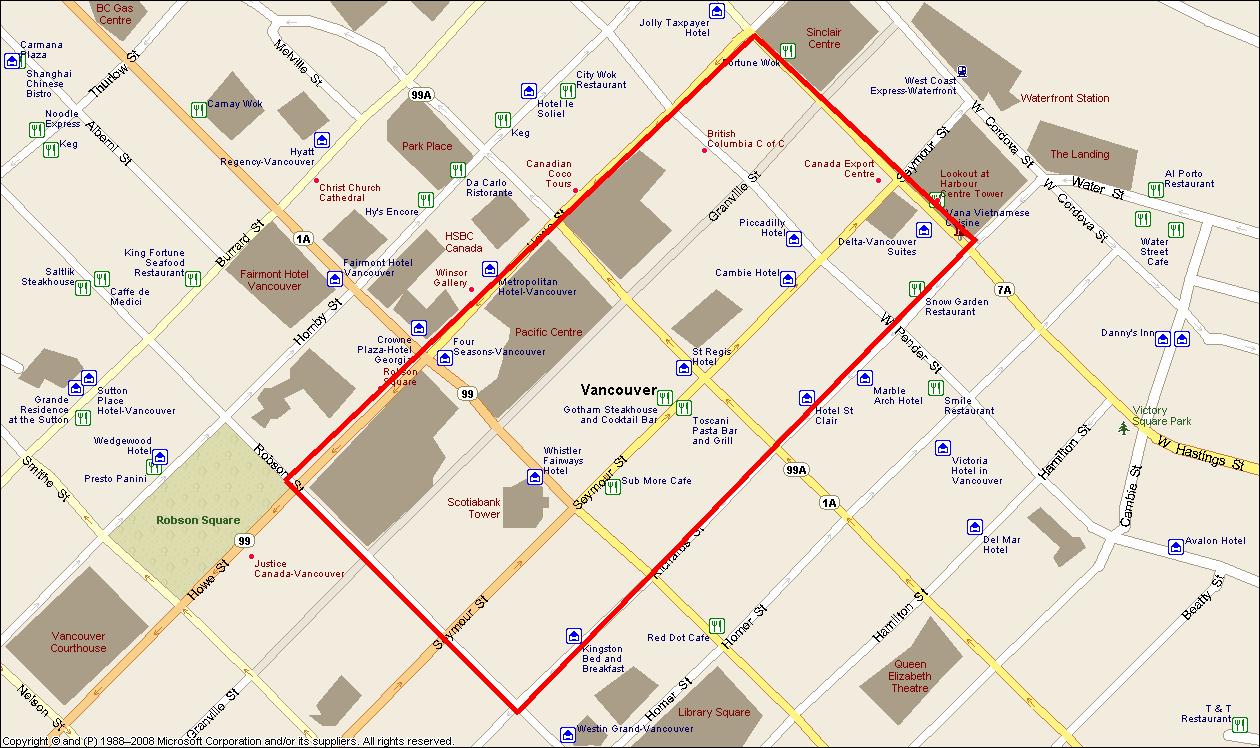
3. Using MapPoint to create a custom study area: Polygons
- Select New Project Wizard
- Click on Use a Map to define polygon, circle, or drive time areas, then click Next.
- Select Polygon, then click Next.
- Select Tracing on a Map as the method for drawing the polygon, then click Next.
- A map will appear. You will probably need to change the map view using the Adjust Map tool box. Click Continue when you are finished adjusting. You can also zoom to a location by typing in an address – click the binocular icon. Address:
- Country: Canada
- Street Address: 515 West Hastings
- City: Vancouver
- Province: B.C.
- Postal Code: V6B 5K3
- Click Find, then OK. An adjusted map view will appear with a point indicating the address location.
- Drawing a polygon:
- Right-click set a point on the map. Start at the corner of West Hastings and Howe Street (right-click), then drag the line south to on Howe to Robson.
- Right-click at Howe and Robson, and drag the line up Robson to Richards.
- Right-click, and drag the line up Richards back to West Hastings. Double-click to finish the polygon.
- The Study Area Wizard window now appears. The shape name is Traced Polygon. Click Next.
- Selections:
- Demographic database: 2006 Census, Release 3 [British Columbia]
- Custom Data Template: default
- Click Finish, and Search Now.
- A map will start generating. The black squares represent dwellings; uncheck Show Points on the map to hide these squares, and click Continue.
- After the map is generated, the data will display in a column. Click on the title tab Census Snapshot to select different categories of information. Click on the Map tab to view the map and the drawn polygon.
- Click on Export on the menu bar, and select Export Map as Graphic...
- Insert your USB drive, and browse to its drive location on the computer terminal.
- File name: MapPointPolygonExercise; Save as Type: Windows bitmap (*.bmp).
Note: Select Circle or Drive Times from the options in the Mapped Study Area window for another way of defining a custom study area. See the previous exercise.
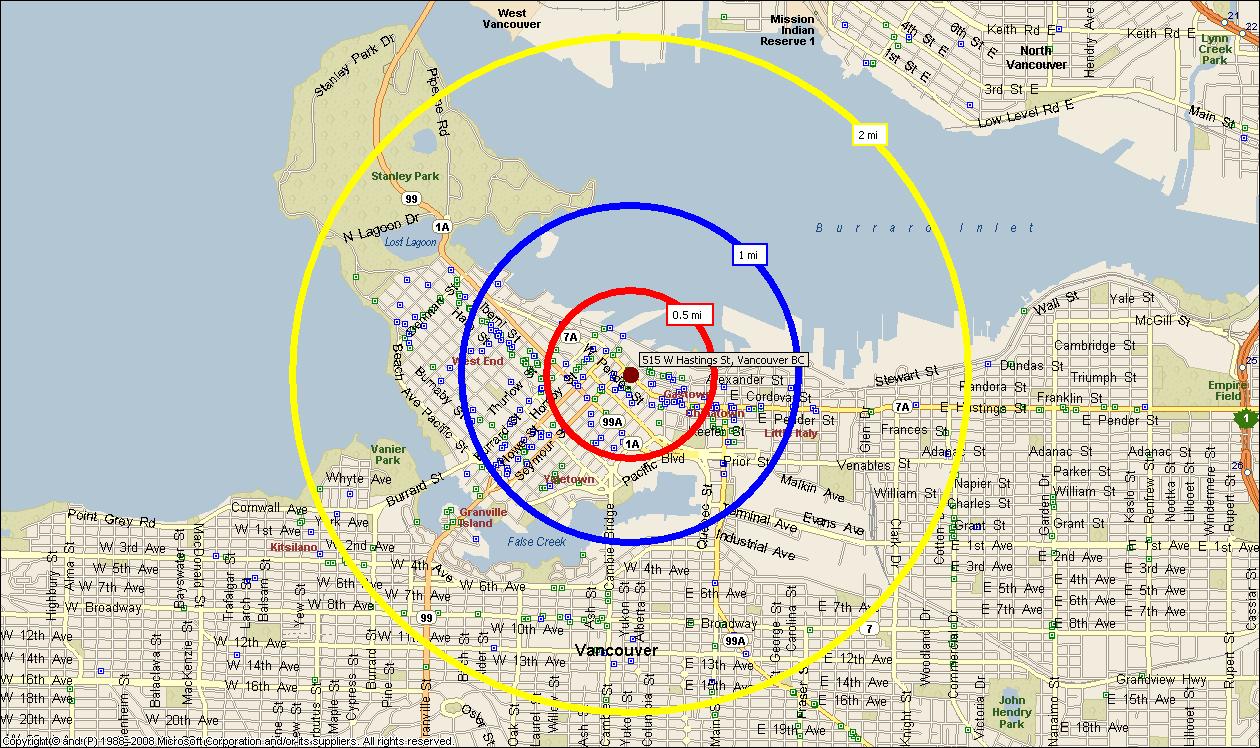
4. Using MapPoint to create a custom study area: Circle
- Select New Project Wizard
- Click on Use a Map to define polygon, circle, or drive time areas, then click Next
- Select Circle, then click Next
- Entries:
- Country: Canada
- Street Address: 515 West Hastings
- City: Vancouver
- Province: B.C.
- Postal Code: V6B 5K3
- Click Find, then Next. A map and a new menu will appear.
- You can now choose how many rings to draw around your selected address, and the distance range(s) between each. Choose 3 rings: 0-0.500, 0.500-1.00, 1.00-2.00. Select Miles as the Distance units.
- Click Next. You are now given the option to change the name of the shape. Click Next.
- Selections:
- Demographic database: 2006 Census, Release 3 [British Columbia]
- Custom Data Template: default
- Click Finish, and Search Now.
- A map will be generated showing the three rings around your address point. The black squares represent dwellings; uncheck Show Points on the map to hide these squares, and click Continue.
- After the map is generated, the data will display in three columns that correspond to the circle ranges. Click on the title tab Census Snapshot to select different categories of information.
- Click on the Map tab, then Export on the menu bar, and select Export Map as Graphic...
- Insert your USB drive, and browse to its drive location on the computer terminal.
- File name: MapPointCircleExercise; Save as Type: Windows bitmap (*.bmp).
Note: Select Polygon or Drive Times from the options in the Mapped Study Area window for another way of defining a custom study area. See the previous exercise.
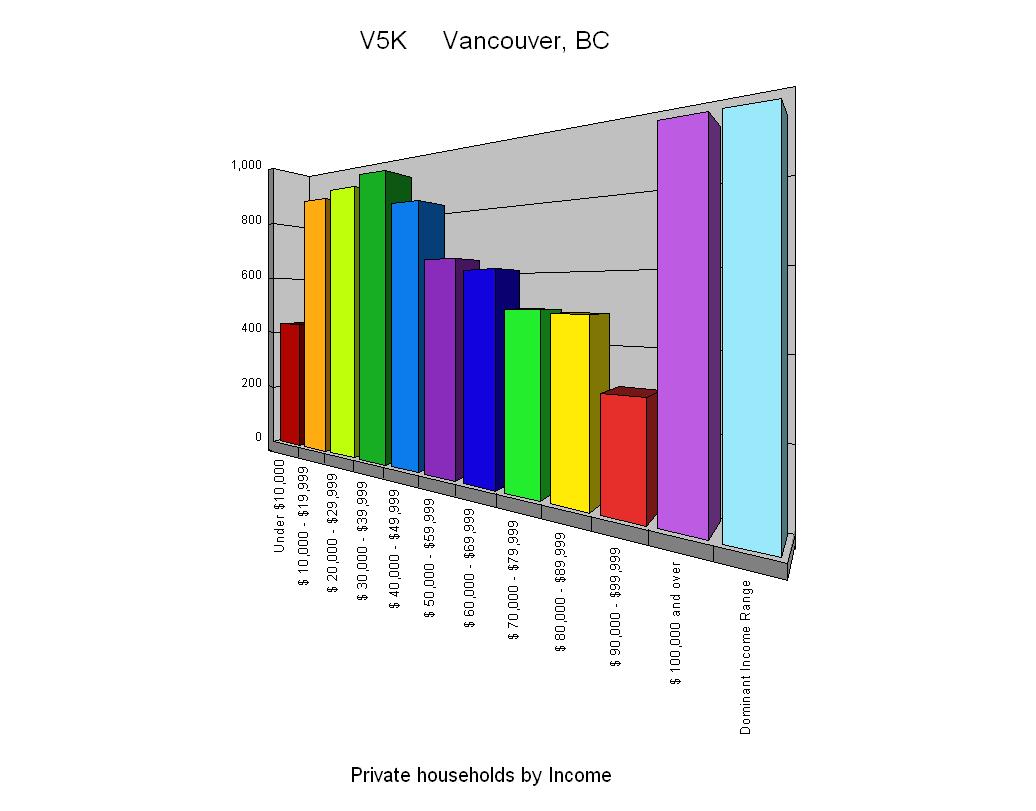
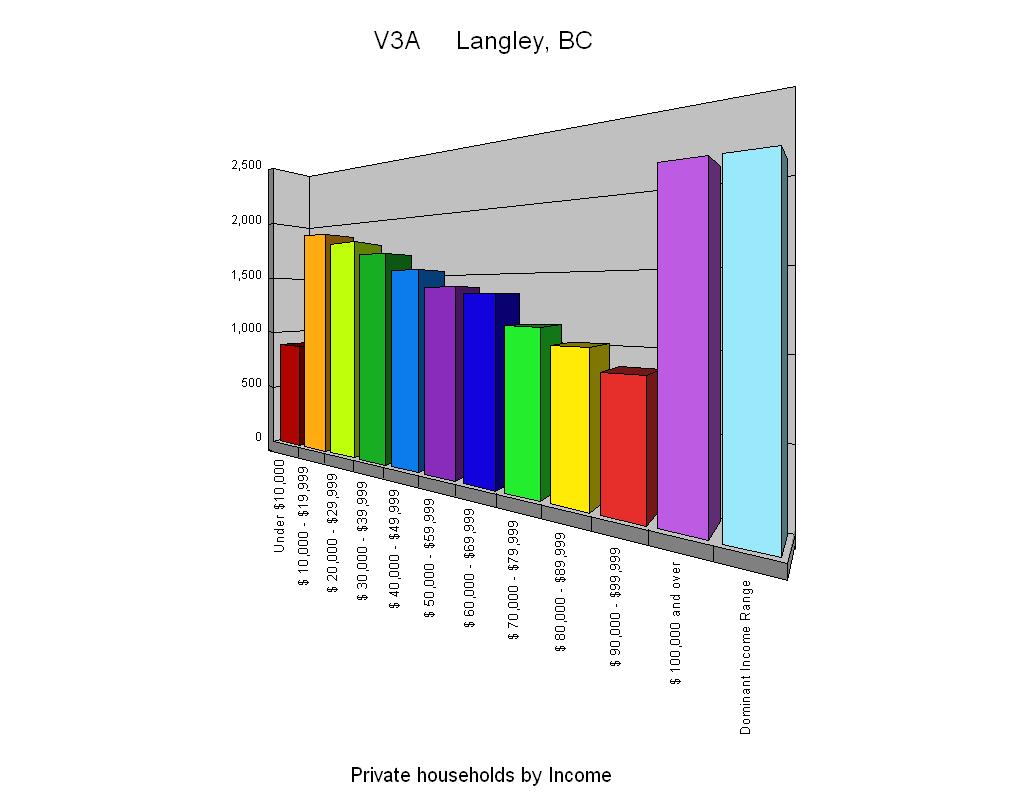
5. Comparison of household income by FSA, with exported graph
- Select New Project Wizard
- Click on Select a Predefined Area, then click Next
- Selections:
- Demographic database: 2001 Census [British Columbia]
- Custom Data Template: default
- Predefined Area Type: Postal FSA
- Click Next.
- Type “VA” to skip to Vancouver and select V5K Vancouver, then click Next, Finish, and Search Now.
- The data from this FSA will display in a columnar list. Click on Study Area on the menu bar and select New Predefined Study Area.
- Repeat Steps 3 – 5, selecting V3A Langley as the FSA. A second columnar list of data will appear next to the first.
- Click on the title tab 2006 Census Snapshot to select a new data category: 2000 Household Income.
- Click on the Profile Graph tab to view the data in graph form. Selections for category variables:
- FSA (Study Area(s))
- Graph values: default
- Private Households by Income
- Percent Groups
- Click Export on the menu bar, and select Export Graph as Graphic.
- Insert your USB drive, and browse to its drive location on the computer terminal.
- File name: V5K-Vancouver; Save as Type: Windows bitmap (*.bmp).
- Now select V3A Langley to view this FSA graph. Repeat steps 9-11 to export this graph, naming the file V3A-Langley.
6. Family structure and children in the Vancouver CMA, exported and displayed as HTML
- Select New Project Wizard
- Click on Select a Predefined Area, then click Next
- Selections:
- Demographic database: 2006 Census Release 3 [British Columbia]
- Custom Data Template: default
- Predefined Area Type: Metro Area (CMA/CA)
- Click Next.
- An alphabetical list will appear. Type “Va” to jump forward and select Vancouver.
- Click Next, Finish, and Search Now.
- Click on the title tab Census Snapshot, and select the category Family Structure and Children.
- Insert your USB drive. From the menu bar, click Export, and select Export Profile Totals
- Select HTML file, then Browse to select the drive location of your USB.
- File name: VancouverCMA-FamilyStructure; Save as Type: HTML File (*.htm)
- Click Save.
- Make sure the View Created File box is checked and click OK.
- An Internet Explorer window will open with the data displayed.
7. Population summary comparison of LA and Seattle, exported as an Excel spreadsheet
- Select New Project Wizard
- Click on Select a Predefined Area, then click Next
- Selections:
- Demographic database: 2000 Census SF1+ [United States]
- Custom Data Template: default
- Predefined Area Type: Place
- Click Next
- A long alphabetical list of locations will appear. Type “Seat” to jump forward in the list and select Seattle City, WA as the place name.
- Click Next, Finish, and Search Now.
- The data will display in a columnar list. Click Study Area on the menu bar and select New Predefined Study Area.
- Repeat Steps 3-5, selecting Los Angeles City, CA as the place name.
- Click on the Population Summary title tab to view other data categories. Click Cancel.
- Insert your USB drive. Click Export on the menu bar, and select Export Profile Totals…
- File format: Excel spreadsheet; Title: LA/Seattle Population Summary Comparison.
- Make sure the View Created File box is checked, and click OK to view the file.
- An Excel workbook will open. Click File on the menu bar and select Save As… to save the Excel file to your USB drive.
Note: The Add Another button in the Predefined Area Type selection box will combine data from cities , counties, and states in any combination you choose. You can also use this exercise outline to compare states to cities, cities to counties, etcetera.
8. Canada/US comparison – California and B.C.
- Select New Project Wizard
- Click on Select a Predefined Area, then click Next
- Selections:
- Demographic database: 2000 Census SF1+ [United States]
- Custom Data Template: default
- Predefined Area Type: State
- Click Next
- A long alphabetical list of locations will appear. Type “C” to jump forward in the list, and select California.
- Click Next, Finish, and Search Now.
- The data will display in a columnar list. Click Study Area on the menu bar and select New Predefined Study Area.
- Selections:
- Demographic database: 2001 Census [British Columbia]. A Message Box will appear: “The selected database is not the same type as used by the other study areas in your project. Do you want to use this database anyway?”Click Yes.
- Custom Data Template: default
- Predefined Area Type: Province
- Select British Columbia, and click Next, Finish, and Search Now.
- A second columnar list of data will appear by the first. Some categories will appear blank.
9. Population comparison of Canada, United States, and Mexico
- Select New Project Wizard
- Click on Select a Predefined Area, then click Next
- Selections:
- Demographic database: World Population
- Custom Data Template: default
- Predefined Area Type: Country
- Click Next
- Select Canada then click Next, Finish, and Search Now.
- On the menu bar, click on Study Area and select New Predefined Area Study.
- You will be taken back to the original selection screen. Repeat steps 3-5, selecting United States as the country.
- On the menu bar, click on Study Area and select New Predefined Area Study. Repeat steps 3-5 again, selecting Mexico as the country.
- Click on the title tab Population Trends, and select the category Population Numbers to view the data.
- Click File on the menu bar and select Print
- Enter Population Comparison of Canada, United States, and Mexico as the report header, and select Population Numbers as the category to print.
- Select the appropriate printer, and click Print. Ask a staff member for assistance if your report does not appear in the print queue..
10. Other possible research data outputs
See Sample Reports from previous PCensus Versions for a list of reports.
Additional resources and search aids
The SFU Library has a number of additional resources and search aids that can be used to assist you with your project:
- SFU Library Guide to Using PCensus
- PCensus Users Guide, Version 7.5 [print]
- SFU Canada Census publication guide
- 2006 Census Dictionary by Statistics Canada
- Census metropolitan areas, census agglomerations and census tracts [print]
- Guide to federal electoral districts [print]
- Allocation of area code designators [print]
- Canada's postal code directory
If you encounter difficulties using PCensus, require additional help with your research, or have any other questions, please consult with a librarian at one of our Reference desks or online at Ask a Librarian.
Sample reports from previous PCensus versions
The full sample reports are only included in the binder printouts located at the Bennett information desk. Here is a list of these reports:
- Canada 1995 daytime population, Alberta and B.C. comparison (Sample 1)
- Canada 1995 consumer spending, B.C. and Ontario comparison (Sample 2)
- Canada 1996 Census – B.C. Census Summary (Sample 3)
- Canada 1996 Census – 1995 Individual Total Income – Postal code comparison (Sample 4)
- Canada 1996 Census – Census Tract mode of transportation data (Sample 5)
- Canada 1996 Census – Vancouver Quadra FED summary (Sample 6)
- Canada 1996 Census – Sample Lifestyles – Vancouver and Kelowna comparison (Sample 7)
- Canada – Census History – B.C. Citizenship (Sample 8)
- 1995 Consumer Spending – Compares B.C. to the rest of Canada (Sample 9)
- Canada 1998 Estimates and Projections, B.C. Population Trends (Sample 10)
- Canada 1996 Census Population and Dwellings, CT Profile (Sample 11)
- 1995 Psyte Major Groups, summary data for all of B.C. (Sample 12)
- 1990 STF31 (Standard) – Census of Population and Housing for California (Sample 14)
- PCensus Lifestyle Targeting – Aboriginal Population in Selected Postal Codes